Bar Graph
Pictograph
Line Plot
Mixed Bag
Tally Chart
100
What do bar graphs need to tell the reader what it is about?
What are titles?
100

How many people say their favorite fruit is an apple?
What is 10 people?
100
 On which day were the most cars sold?
What is Friday?
100

How many children were at after school care on Tuesday?
What is 5?
100
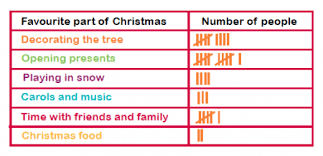
How many people liked "time with friends and family?"
What is 6?
200

How many people own both a rabbit and cat?
What is 15 people?
200

How many apples were sold in February?
What is 40 apples?
200
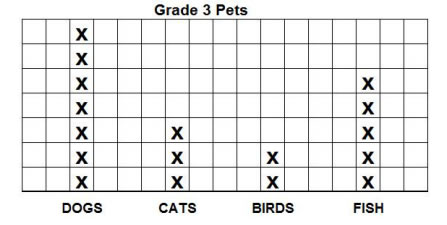
Which pet had the least amount?
What is birds?
200
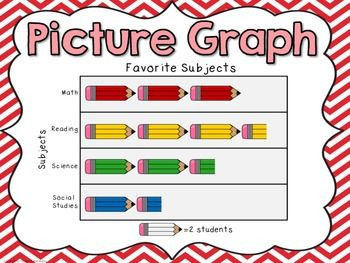
What is the least favorite subject?
What is social studies?
200

What is 17?
300
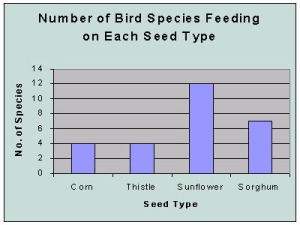
How many fewer birds for Sorghum than Sunflower ?
What is 5?
300
How many people liked the color green?
What is 11?
300
How many kids were taller than 51 inches?
What is 4?
300

How many people like tennis and basketball?
What is 12?
300
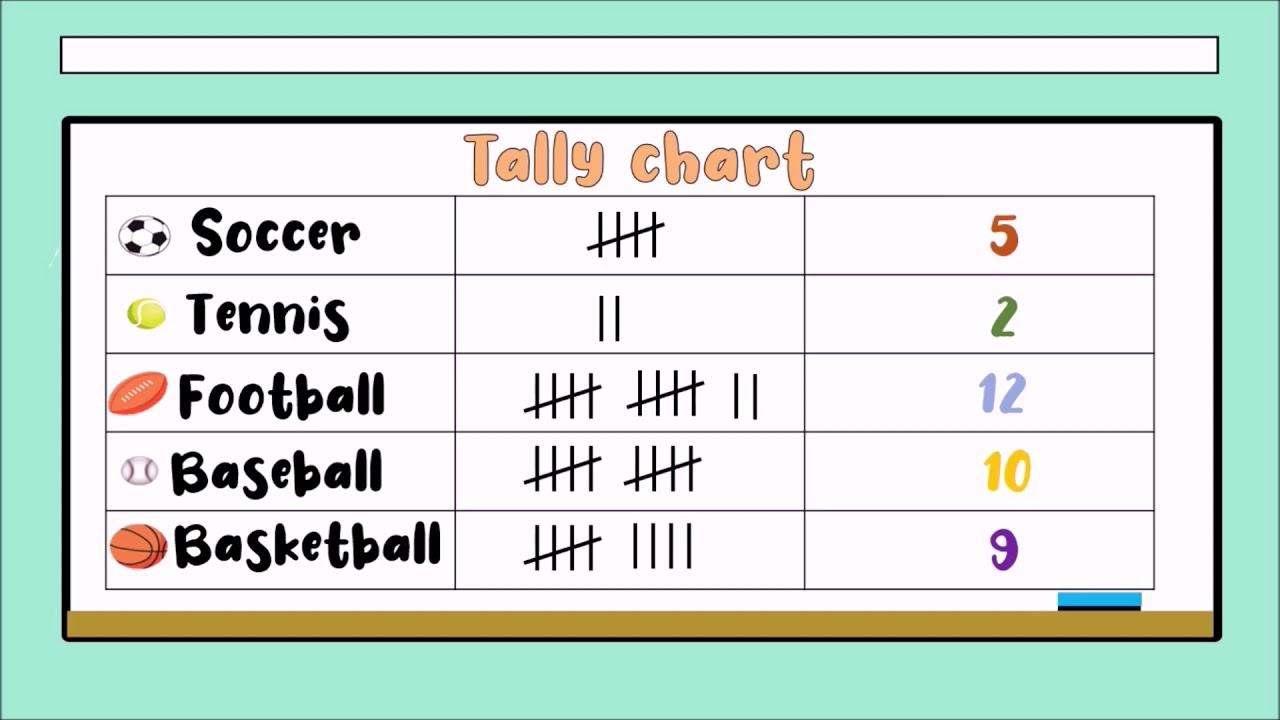
Which two sports equal the same amount as "football"?
What is baseball and tennis?
400

How many students are in 1st and 4th grade combined?
What is 105 students?
400
What is needed in a pictograph that is not needed in other graphs?
What is a key?
400

What is 25?
400
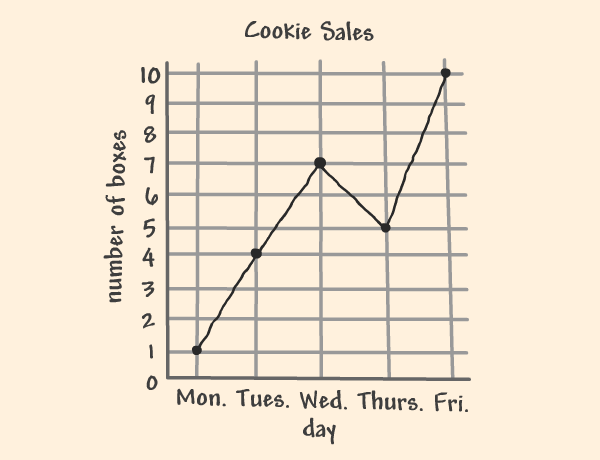
Which day sold 10 boxes of cookies?
What is Friday?
400
If you add up spider, snail, butterfly and bee, how much more would there be compared to "ant"?
What is 6?
500
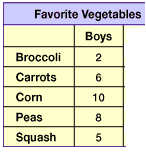
What is the total number of boys surveyed?
31
500
How many more students liked hockey and baseball combined than soccer?
What is 10?
500
What feature are line plots missing?
What is a "scale" on the side of the graph?
500

Which days had the same amount of push-ups?
What is Sunday and Tuesday?
500
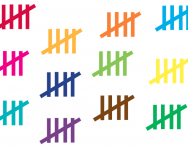
What is the total of these tallies?
What is 60?