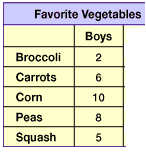
Bar Graph
Pictograph
Line Graph
Mixed Bag
Tally Chart
100

How many students favorite sport is basketball?
What is 6 students?
100

How many people say their favorite fruit is an apple?
What is 10 people?
100
 On which day were the most cars sold?
What is Friday?
100

How many children were at after school care on Tuesday?
What is 5?
100
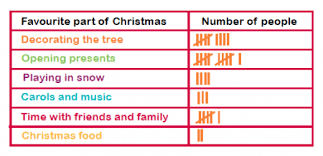
How many people liked "time with friends and family?"
What is 6?
200

How many people own both a rabbit and cat?
What is 15 people?
200

How many apples were sold in February?
What is 40 apples?
200
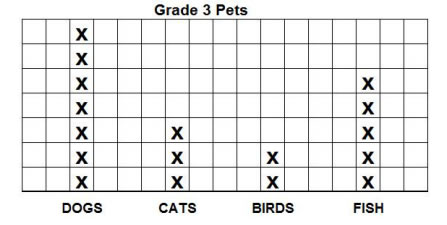
Which pet had the least amount?
What is birds?
200
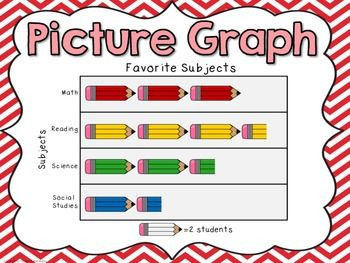
What is the least favorite subject?
What is social studies?
200
Go up to the board, and correctly draw 17 tallies.

300
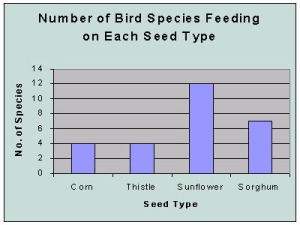
How many fewer birds at Sorghum than Sunflower ?
What is 5?
300
How many people liked the color green?
What is 11?
300
 Which month has the highest Produce sales?
What is June?
300

How many people like tennis and basketball?
What is 12?
300
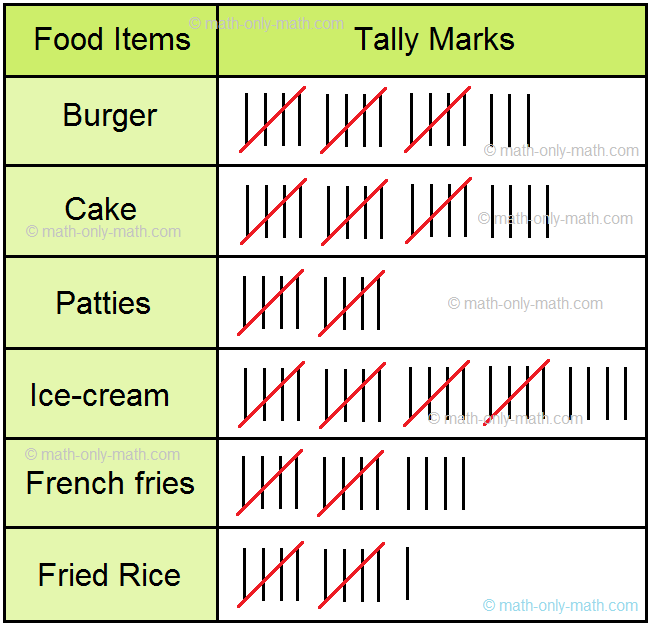
How many people were surveyed based on the Tally Chart above?
What is 96
400

How many more students are in 1st and 4th grade combined, than in third grade?
What is 90 students?
400

How many people voted for Walking?
What is 24?
400

Which animal(s) had an increase in population?
What is Bears?
400
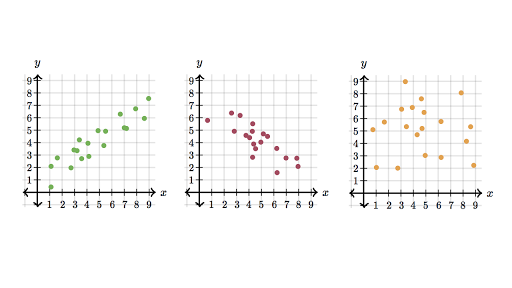
What is the 2nd graph?
400

How many more people prefer Cherry than Grape
What is 14?
500
Go up to the board and accurately draw the bar graph, making sure to label.
(add bars)
500
How many more students liked hockey and baseball combined than soccer?
What is 10?
500

What would be a good title for this graph?
What is Earnings per Day?
500

How many more students voted for Romance than SciFi and Drama combined?
What is 1?
500
What is the total of these tallies?
What is 60?