Bar Graph
Pictograph
Line Plot
Mixed Bag
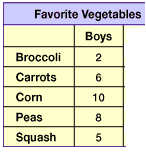
Tally Chart
100

Which pet has the most vote?
Cat
100

How many people say their favorite fruit is an apple?
10 people
100
 On which day were the most cars sold?
Friday
100

How many children were at after school care on Tuesday?
5
100
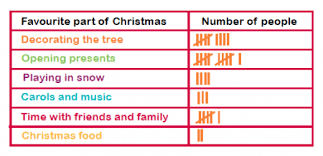
How many people liked "time with friends and family?"
6
200
How many people own both a rabbit and cat?
15
200

How many apples were sold in February?
40 apples
200
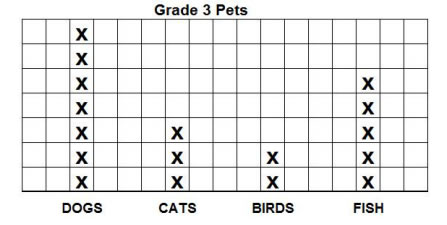
Which pet had the least amount?
Birds
200
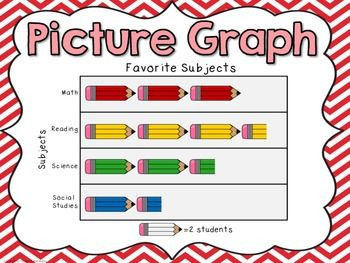
What is the least favorite subject?
Social Studies
200
Go up to the board, and correctly draw 17 tallies.

300
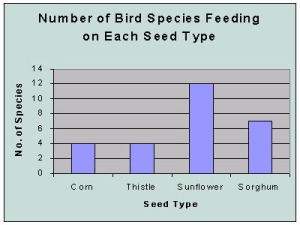
How many fewer birds at Sorghum than Sunflower ?
5
300
How many people liked the color green?
11 people
300
How many kids were taller than 51 inches?
4
300

How many people like tennis and basketball?
12
300

How many more mangoes than strawberries?
7
400

How many students are in 1st and 4th grade combined?
105
400

If the key is 3, how many more people like strawberry than vanilla?
6
400

25
400

How many fewer students like softball than soccer?
What is 5?
400

How many more people prefer coke over Pepsi?
8
500
Go up to the board and accurately draw the bar graph, making sure to label.

(add bars)
500
How many more students liked hockey and baseball combined than soccer?
10 students
500

How many people bought 3 or more books?
10
500

How many more students voted for fruit than crackers and vegetables combined?
What is 2?
500
What is the total of these tallies?
60