Bar Graph
Line Graph
Random
Frequency Table
100

How many people own both a rabbit and cat?
15
Explain: Rabbit + Cat = 4+11= 15
100
When do we use a Line Graph?
What is to show change over a period of time
100

How many children were at after-school care on Monday, Wednesday and Friday?
17 children
Explain: 6+8+3=17
100
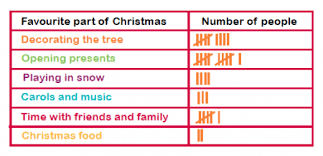
How many people liked "time with friends and family?"
6
200

How many students love playing rugby?
50
Explain: Be careful with Scale! :)
1 unit = 5 students
10 units x 5 = 50 students
200

Which month had the greatest number of vandals?
June
200
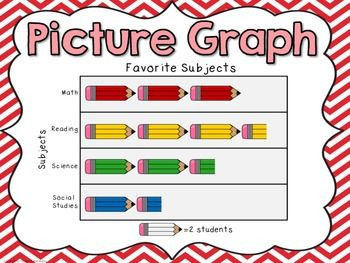
How many students like reading?
7 students
200
Correctly draw 17 tallies.

300
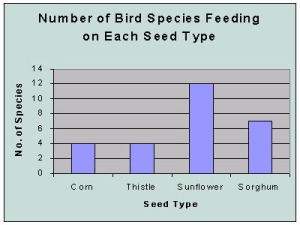
How many fewer birds at Sorghum than Sunflower ?
5
Explain:
Sorghum: 7
Sunflower: 12
The difference: 12-7=5
300
What is the labelling for the horizontal axis?
Months
300

How many people like tennis and basketball?
12
Explain: 5+7=12
300
 How many more customers were there on Saturday than on Monday?
9 customers
Explain: 27-18=9
400

How many more students are in 1st and 4th grade combined, than in third grade?
25 students
Explain:
1st+4th = 50+55 = 105
3th= 80
The difference: 105 - 80=25
400
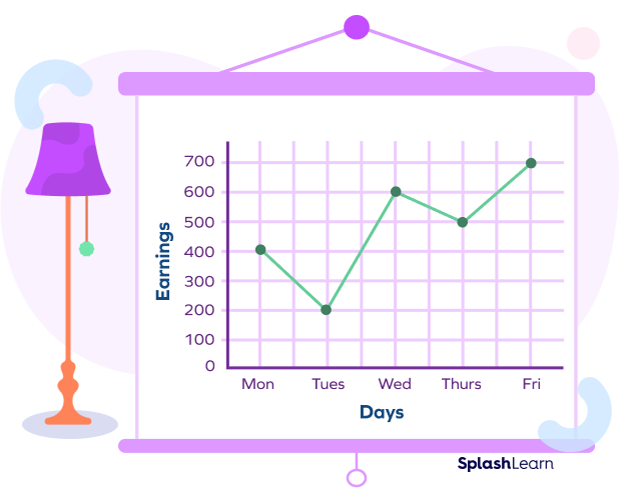
Which two days together were 900 earrings consumed?
Monday and Thursday
400
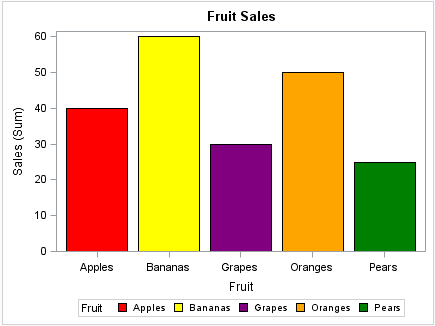 How many fewer sales for grapes than oranges?
20
Explain: 50-30=20
400
How many fewer customers were there on Tuesday than on Sunday?
13 fewer customers
Explain: 26-13=13
500

How many people participated in the survey all together?
145 people
500

How many books were sold all-together from week 1 to week 8?
640 books
500
How many more earrings are sold on Friday than on Tuesday?
500
500
How many more customers on Saturday and Sunday than on Monday?
(27+26)-18= 53-18 = 35 customers