Bar Graph
Pictograph
Circle Graph
Line Graph
Tally Chart
100

How many students favorite sport is basketball?
What is 6 students?
100

How many people say their favorite fruit is an apple?
What is 10 people?
100

What is the most popular movie genre in Mrs. Smyth's class?
What is comedy?
100

What was the temperature at 2pm?
What is 60 degrees?
100
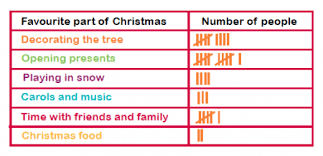
How many people liked "time with friends and family?"
What is 6?
200

How many people own both a rabbit and cat?
What is 15 people?
200

How many apples were sold in February?
What is 40 apples?
200

What is the least amount?
What is "phone"?
200
 What was the least and most amount of candy bars sold by the third grade class?
What is 10 were the least, and 45 were the most?
200
Go up to the board, and correctly draw 17 tallies.

300

How many fewer boys like soccer than girls?
What is 3?
300
How many people liked the color green?
What is 11?
300
What percentage of people like both drama and horror combined?
What is 25%?
300
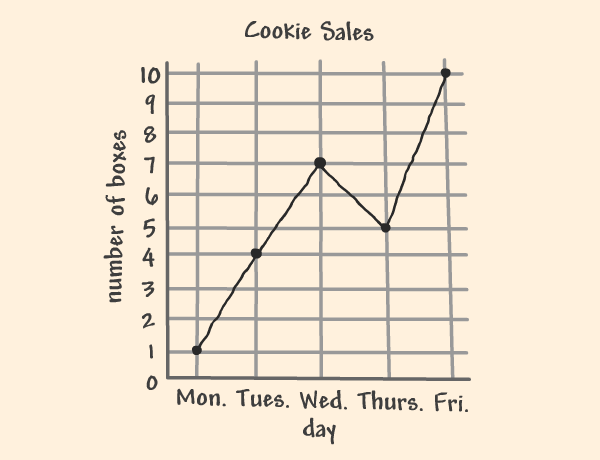
What is the difference of cookies sold between Friday and Wednesday?
What is 3?
300

What is the difference between mangos and strawberries?
What is 7?
400

How many students like vanilla ice cream in both 1st and 3rd grade?
What is 90 students?
400

If the key is 3, how many more people like strawberry than vanilla?
What is 6?
400
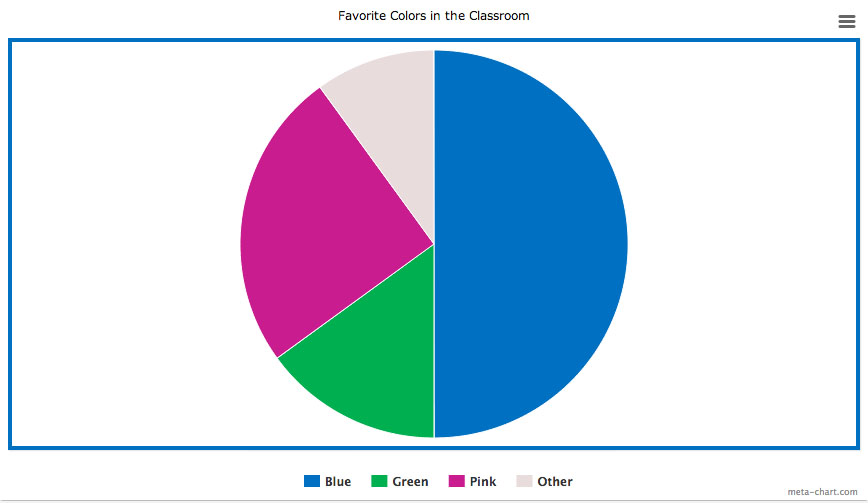
What percent is the blue shaded?
What is 50%?
400
What's the difference in temperature between 5am and 11am?
What is 20 degrees?
400

How many more people prefer coke over Pepsi?
What is 8?
500

Go up to the board and accurately draw the double bar graph, making sure to label.

(add bars)
500
How many more students liked hockey and baseball combined than soccer?
What is 10?
500

Did people eat more ice cream or bread AND vegetables?
What is ice cream?
500

What is the difference between February 2004 & July 2005?
What is 4,000?
500
What is the total of these tallies?
What is 60?