Bar Graph
Pictograph
Line Plot
Mixed Bag
Tally Chart
100

How many students favorite sport is basketball?
6 students
100

How many people say their favorite fruit is an apple?
10 people
100
 On which day were the most cars sold?
Friday
100

How many children were at after school care on Tuesday?
5 children
100
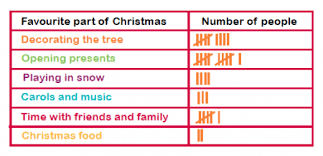
How many people liked "time with friends and family?"
6 people
200

How many people own both a rabbit and cat?
17 people
200

How many apples were sold in February?
40 apples
200
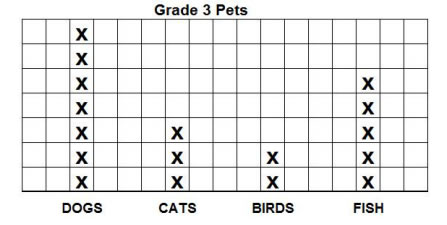
Which pet do students have the least amount?
Birds
200
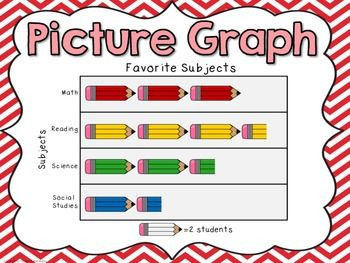
What is the least favorite subject?
Social Studies
200

17
300
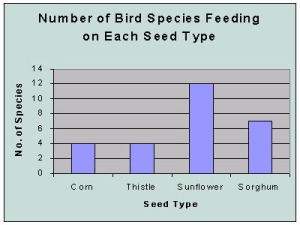
How many fewer birds eat Sorghum than Sunflower ?
5 birds
300
How many people liked the color green?
11 people
300
How many kids were taller than 51 inches?
4 kids
300

How many people like tennis and basketball?
11 people
300
How many categories are listed?

6 categories
400

How many more students are in 5th grade than in 1st grade?
20 students
400
What does the key of this graph tell us?
1 soccer ball = 10 students
400

25 patrons
400

How many fewer students like softball than soccer?
5 students
400

How many more people prefer Coke over Pepsi?
What is 8?
500
How many people participated in this survey?
31 people
500
How many more students liked hockey and baseball combined than soccer?
10 students
500

How many people bought 3 or more books?
10 people
500
What is the most popular sport?
Soccer
500
What is the total number of Apple Juice and Milk combined?
32