Bar Graph
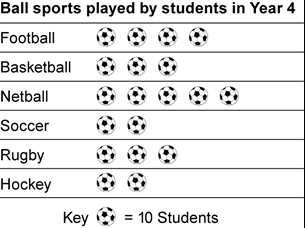
Pictograph
Line Plot
Mixed Bag
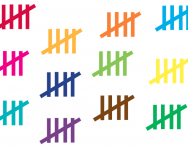
Tally Chart
100
What kind of graph is the following?

What is a bar graph?
100
Information that is collected and represented on a graph is called ___________________.
What is data?
100

What is Friday?
100

How many children were at after school care on Tuesday?
What is 5?
100
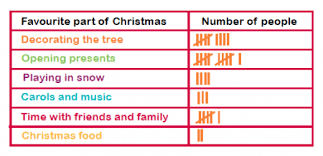
How many people liked "time with friends and family?"
What is 6?
200

How many people own both a rabbit and cat?
What is 15 people?
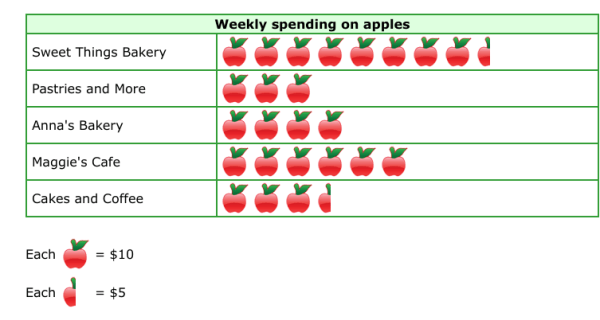
200

How many apples were sold in February?
What is 40 apples?
200
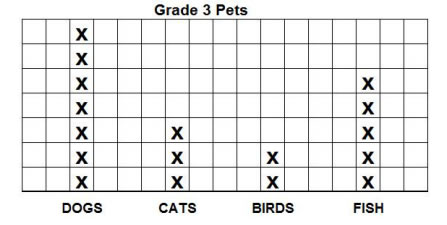
Which pet had the least amount?
What is birds?
200
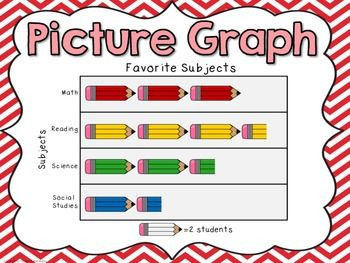
What is the least favorite subject?
What is social studies?
200
Go up to the board, and correctly draw 17 tallies.

300
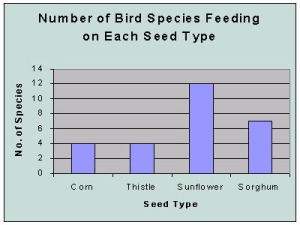
How many fewer birds ate Sorghum than Sunflower ?
What is 5?
300
How many people liked the color green?
What is 11?
300
How many kids were taller than 51 inches?
What is 4?
300

How many people like tennis and basketball?
What is 12?
300
How many more people prefer mangoes over strawberries?
Go to the board and draw a tally chart of the answer.
400

How many more students are in 1st and 4th grade combined, than in third grade?
What is 90 students?
400
What is the name of the following?
What is a picture graph?
400

What is 25?
400
Marks used to count things instead of using numbers are called _________________.
What are tally marks?
400
How many more people prefer Coke over Pepsi?
Go to the board and draw a tally chart of the answer.
500
Go up to the board and accurately draw the bar graph, making sure to label.

(add bars)
500
How many more students liked hockey and baseball combined than soccer?
What is 10?
500
What does each X in this line plot represent?
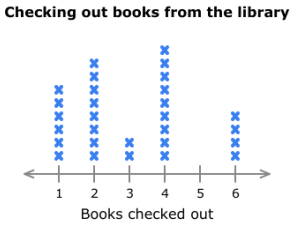
Each X represents a book checked out of the library.
500
How many 2nd graders played basketball this year?
What is 30?
500
What is the total of these tallies?
What is 60?