Bar Graph
Pictograph
Mixed
Tally Chart
Read the chart
100

How many students favorite sport is basketball?
What is 7 students?
100

How many people say their favorite fruit is an apple?
What is 10 people?
100

How many children were at after school care on Tuesday?
What is 5 children?
100
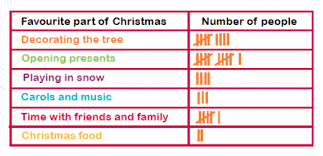
How many people liked "time with friends and family?"
What is 6 people?
100

How many students took the bus or car to school?
16
200

How many people own both a rabbit and cat?
What is 15 people?
200

How many more students have dogs then fish?
What is 2 students?
200
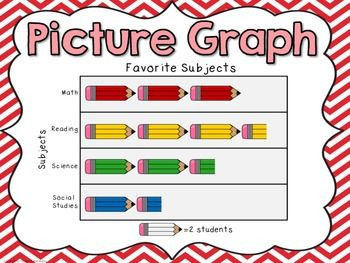
What is the least favorite subject?
What is social studies?
200
On your whiteboard, correctly draw 17 tallies.

200
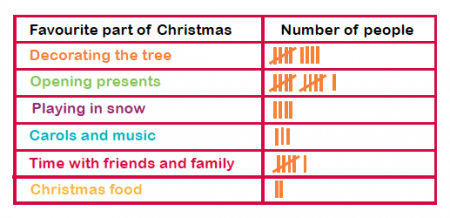 Which part of Christmas was the least favorite?
Christmas food.
300
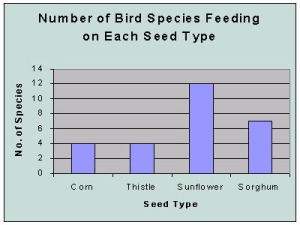
How many more birds are at Sunflower and Sorghum?
What is 5 birds?
300
How many people liked the color green?
What is 11 people?
300

How many people like tennis and basketball?
What is 12 people?
300
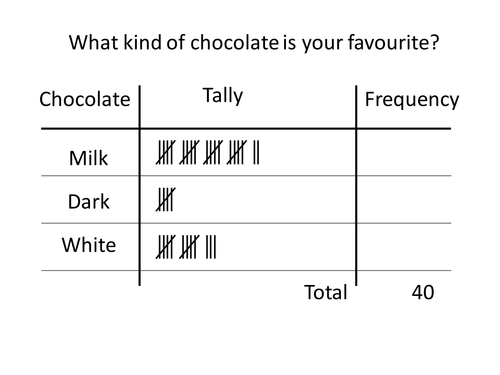
How many people like white and milk chocolate all together?
What is 35 people?
300

How many students found ants and butterflies?
17 students
400

How many more students are in 1st and 4th grade combined, than in third grade?
What is 90 students?
400
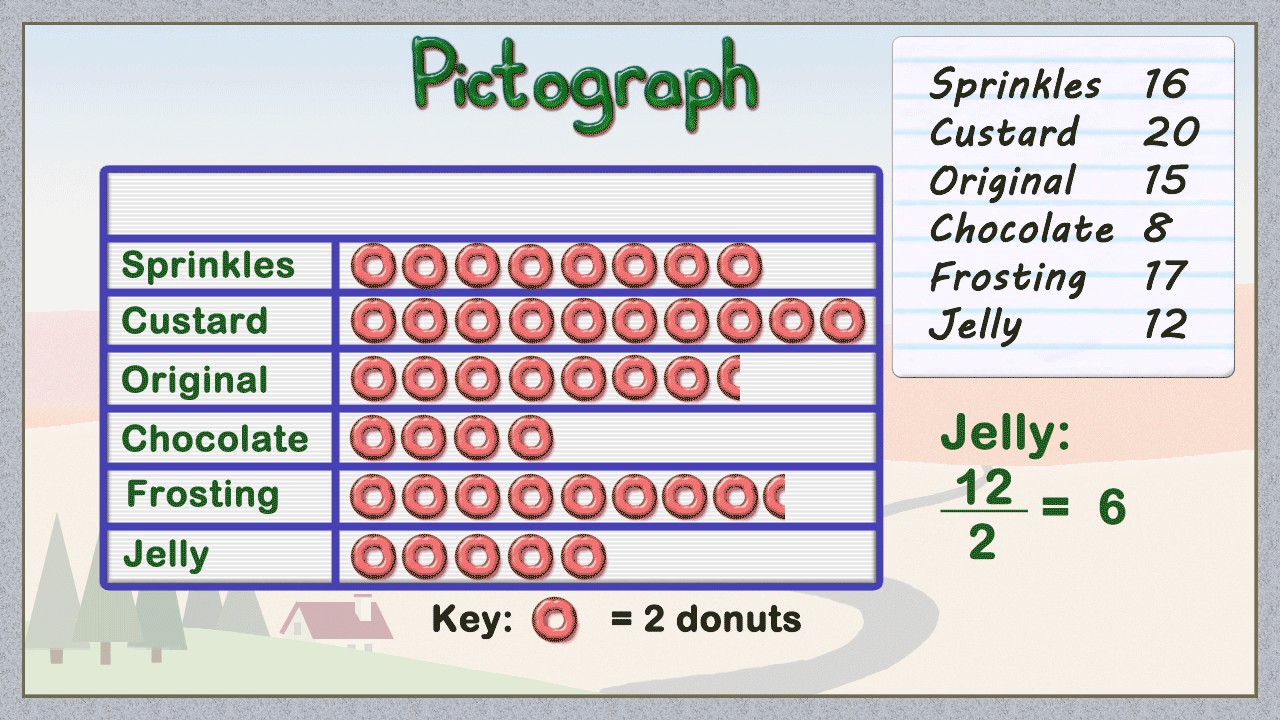 How many people like chocolate and jelly?
What is 18 people?
400

How many more students did an ice cream stand then yard work?
What is 10 students?
400

How many more people prefer cats over dogs?
What is 6 people?
400
How many more students liked horses then pandas?
5 students
500
Create your own bar graph using the information provided
See students work.
500
How many more students liked hockey and baseball combined than soccer?
What is 10 students?
500
 How many more laps did Austin run then William
What is 4 laps?
500
What is the total of these tallies?
What is 60?
500
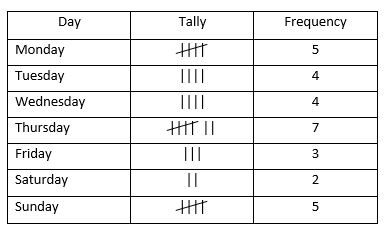
How many people were tallied in all?
30