Investigation
Reading Graphs
Probability
100
Paulo counts the number of animals on his father's farm. He needs to organize the information. Which animal does his father have the most of? 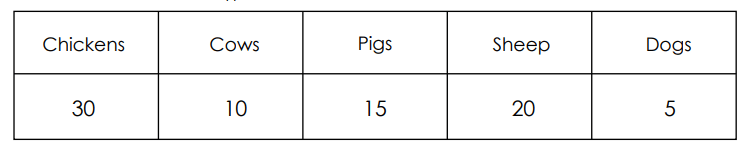
Chickens
100
How many kids chose chocolate milk and white milk altogether?
10
100
How many different colors can you land on?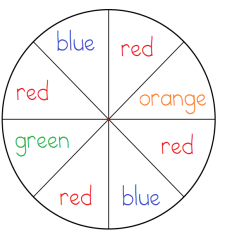
4
200
Luis is collecting data to create a graph for a Science project. What would be a good question to investigate that would provide data for a graph?
A. Is it sunny outside today?
B. Which type of vegetable grows faster?
C. What time is snack?
D. When is field day?
B
200
How many more kids chose fruit juice than white milk?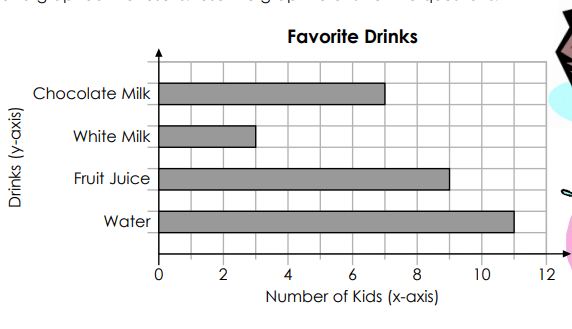
6
200
The band consists of 8 women and 2 men. How likely is it that a man will be the drum player?
A. Impossible
B. Unlikely
C. Likely
D. Certain
B. Unlikely
300
Chuck needs to collect, organize, and graph data for school. What would be a question to investigate that would give data for a graph?
A. What time will my class eat Lunch today?
B. When is our next Soccer game?
C. How long are we going to work on this?
D. How long does it take each student in the class to wash their hands?
D
300
How many fish did Michael catch?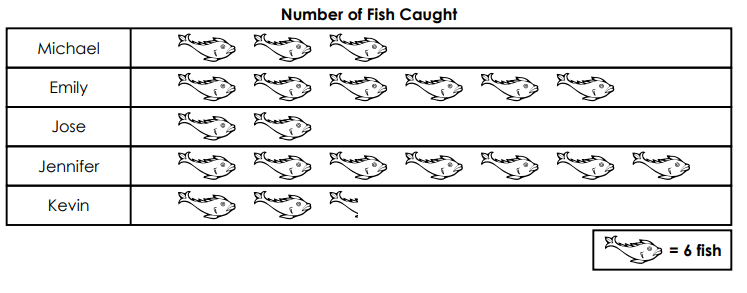
6
300
This list shows the number of color of marble Georgia has mixed up in a bag.
-7 pink
-2 blue
-1 rainbow
She will take 1 marble from the bag without looking. Which best describes the likelihood that Georgia will take a pink marble on her first try?
A. Likely, but not certain
B. Unlikely, but not impossible
C. Impossible
D. Certain
A. Likely, but not certain
400
Zelle has collected coins from different countries and wants to organize the information. What axis is she going to put the country names on?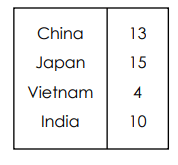

X-Axis
400
How many more cupcakes were baked on Monday than Wednesday?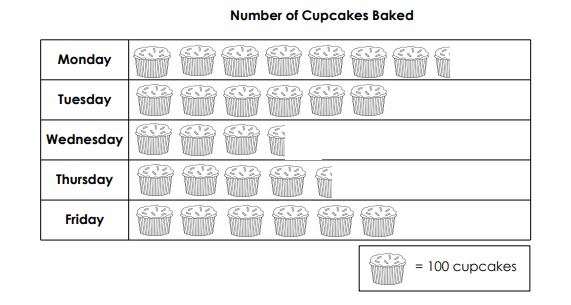
400
400
Cho spins this spinner one time. Which best describes the chances that the spinner will land on a spade?

A. Equally Likely
B. Likely
C. Unlikely
D. Certain
C. Unlikely
500
What would be the best title for this picture graph?
.
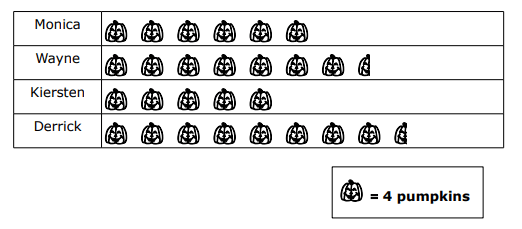
A. Favorite Fall Pies
B. Number of Pumpkins Carved
C. Number of Hay Rides Taken
D. Number of Christmas Trees Decorated
B
500
Janice earned the money listed below at her Lemonade Stand. Does the graph correctly show the data?
Friday:$25
Saturday:$35
Sunday:$10
Monday:$10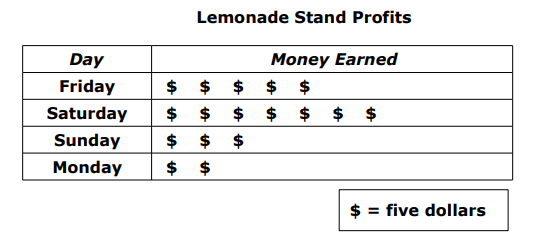
NO
500
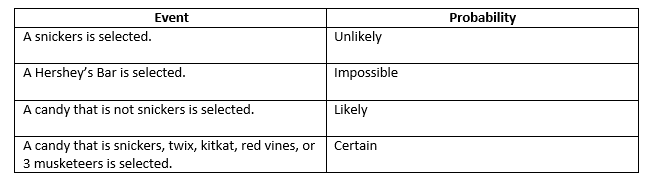
There are five candies in a bag: snickers, twix, 3 musketeers, red vines, and kitkat. Randomly, a candy is selected out of the bag. Complete the table with the correct probability for each event.
Options: Unlikely, Likely, Impossible, Certain![]()