Bar Graphs
Dot Plots
Frequency Tables
Histograms
Distributions
100
Which class period has the second least amount of students?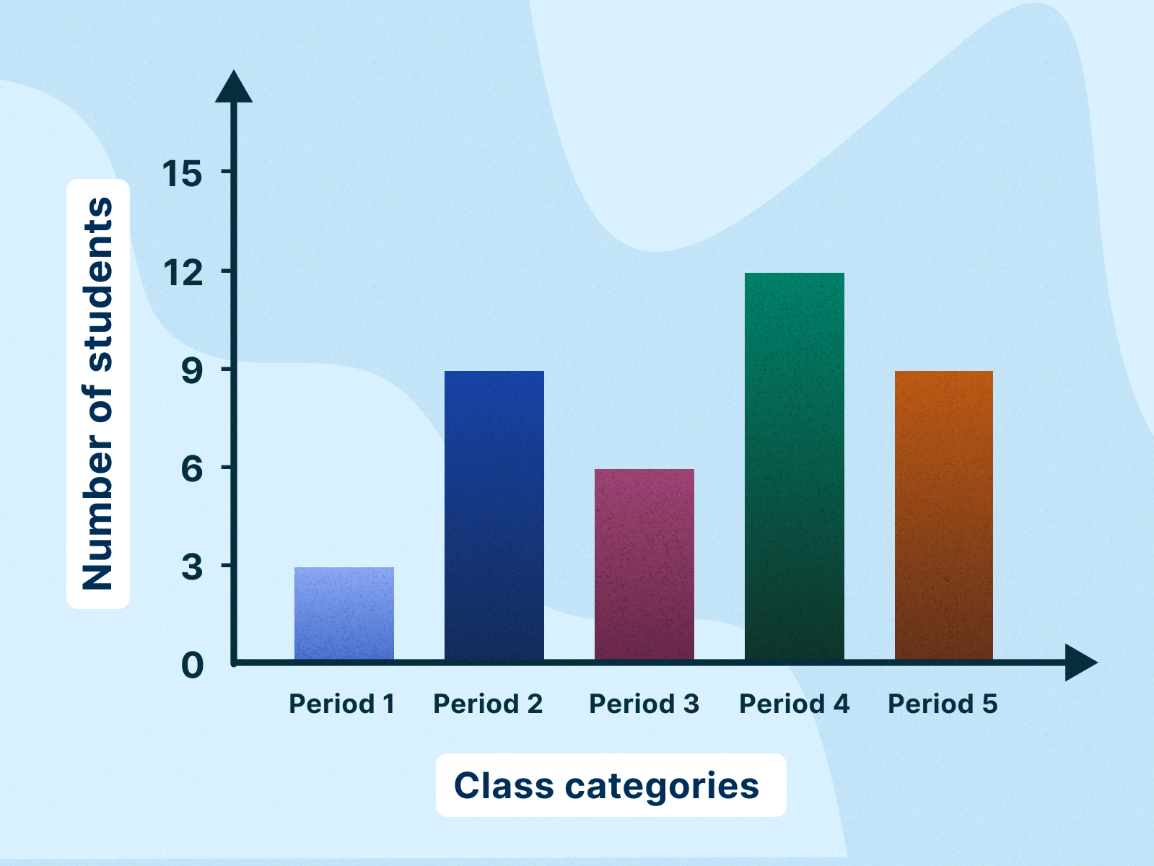
Period 3
100
What is the range of goals scored?
7
100
Which class intervals have a frequency greater than 2?
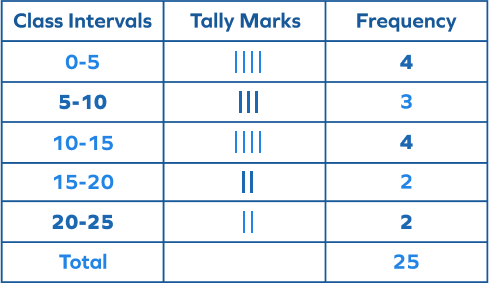
0-5
5-10
10-15
100
What is this graph missing?
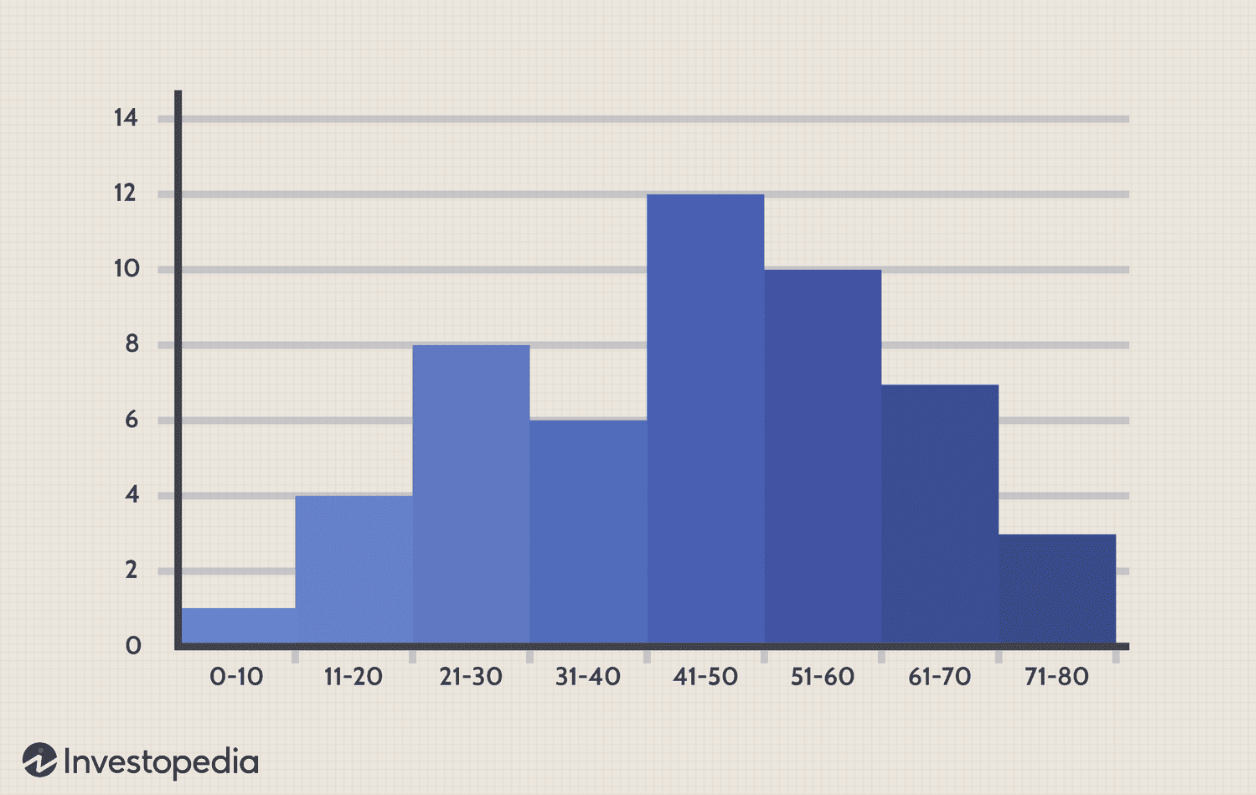
X & Y AXIS LABELS!
What do the x-axis & y-axis represent?
100
Name the general distribution of this graph
Bell curve
200
How many more students walk to school than ride the bus?
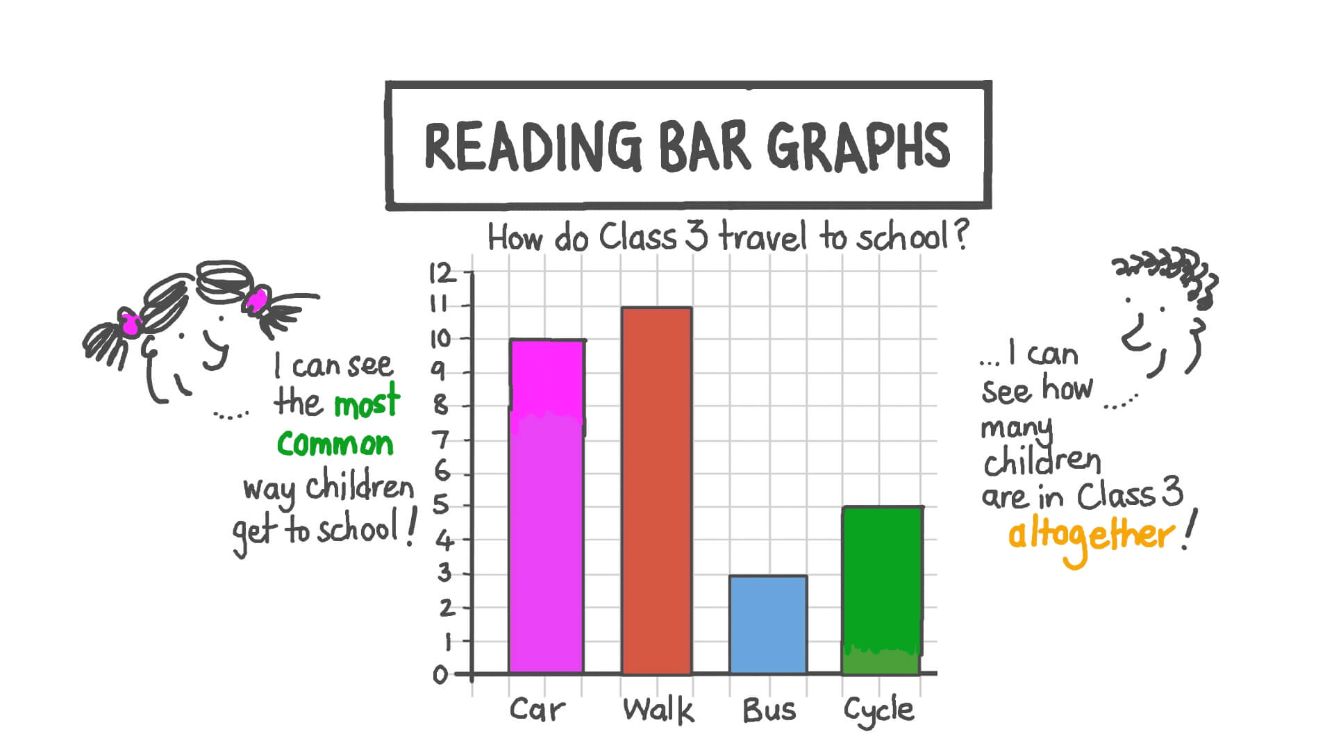
11 - 3 = 8 more students.
200
The following is a dot plot to show the number of hours people exercise and/or play video games a week.
1.) How many more people exercise for 2 hours than play video games for 2 hours? 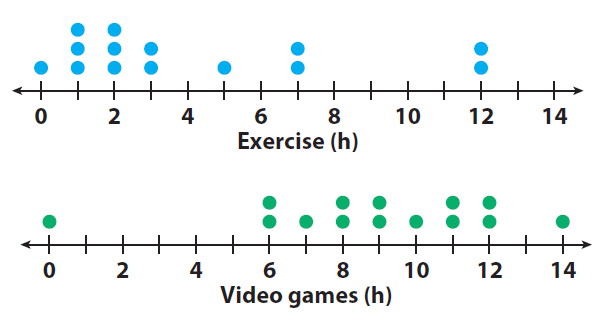
3 people
200
How many total cars were sold this year from January to May?
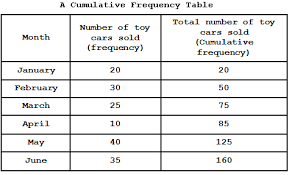
125 cars
200
The graph shows that about 1,000 properties were sold in which price ranges?
- $350k-400k
- greater than $500k
200
!Name this distribution (name both!)
Two modes, symmetrical
300
On which day did the restaurant sell just as many chicken burgers as beef burgers?
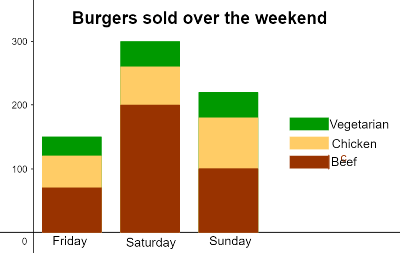
Sunday
300
1.) How many people in total took this survey?
2.) Which snack did more than 5 people prefer?
1.) 26
2.) twizzlers & popcorn
300
Name the range & mode of this data.
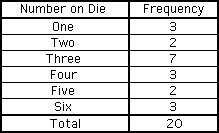
Range = 5
Mode = 3
300
Which age groups both had about 25 people in it?
- 6-10 years
- 26-30 years.
300
Name this distribution.
Skewed right
400
What is the total number of snow days?

25 snow days
400
How many more students prefer cupcakes & pretzels over popcorn & tacos?
cupcakes = 27
pretzels = 9
27 + 9 = 36
popcorn = 21
tacos = 6
21 + 6 = 27
36 - 27 = 9 students
400
1.) What is the total amount of toy cars that were sold?
2.) What month sold the most amount of cars?
3.) How many more cars were sold in May compared to March?
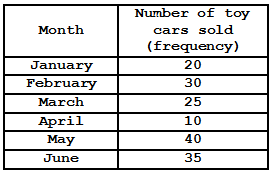
1.) 160 cars
2.) May
3.) 15 more cars
400
1.) How many kids are the tallest in the class?
2.) How many kids are the shortest in the class?
3.) What is the median height range?

1.) 1
2.) 2
3.) 64-66 inches
400
1.) Name this distribution
2.) What is the difference between the orange and green?

1.) Non-symmetrical
2.) 15 - 9 = 6
500
The following bar graph shows the number of students that have completed their diagnostic. If there is a total of 71 students in the grade, how many students are not done yet?

71 - 39 =
32 students that have not yet completed the diagnostic.
500
How many more books do students in period 2 have than period 1?
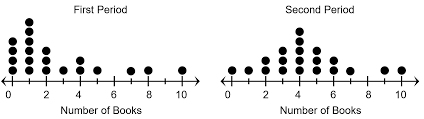
1 = 53 books
2 = 87 books
87 - 53 = 34
Period 2 has 34 more books than period 1.
500
What is the mean (nearest tenth), median, and mode for this data.
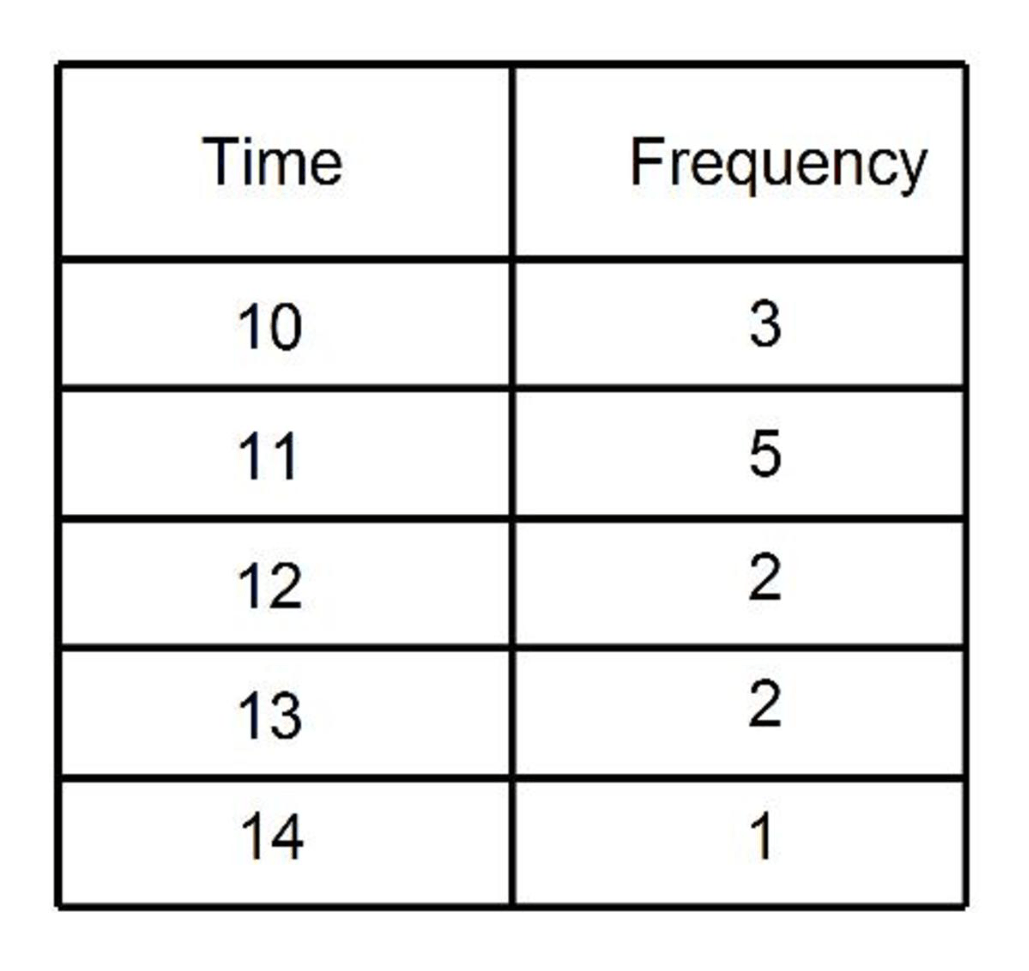
mean - 11.4/11.5
median - 11
mode - 11
500
Pick another team to come up with a question about this histogram.
(This team must have the answer)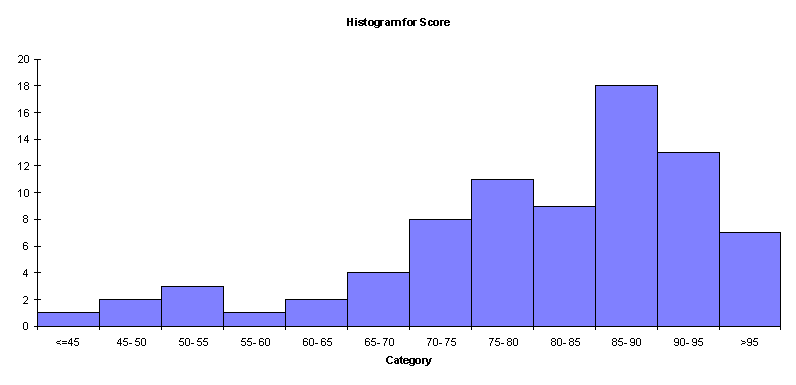
Teams/Teacher Discretion
500
1.) Name this distribution.
2.) 9,500 properties were sold in which price range?
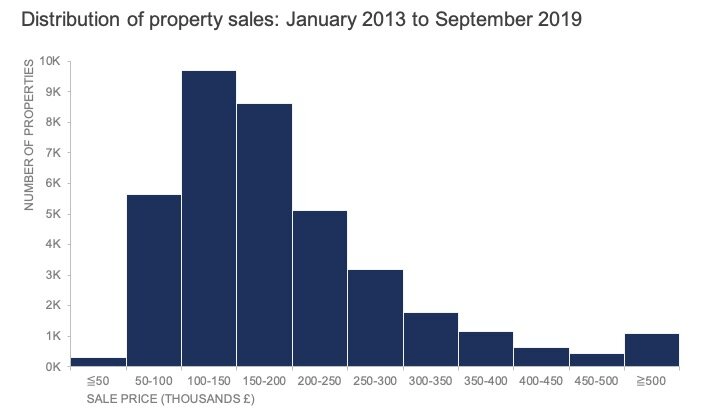
1.) Skewed right
2.) Between $100,000 and $150,000