Interpreting Graphs
More Graphs!
Variables
Experimental Design
Experiment Examples
100
The highest number of lamps have a lifetime of?

between 600-700 hours
100
What type of relationship does this graph show?

Negative relationship (or inverse)... as one variable goes up, the other goes down.
100
This is also called a "standard" - it's a variable that is held constant in order to maintain a controlled experiment
What is a controlled variable?
100
An example of this might be:
"Does a higher spf rating for sunblock provide more protection from UV light than a lower spf rating?"
What is a research question?
100
A researcher wants to investigate the connection between caffeine consumption and resting heart rate in adults. What are some examples of controlled variables they should use in their experimental design?
Same gender of test subjects (all men or all women)
Same age of test subjects
No pre-existing heart conditions
All test subjects have resting heart rate measured BEFORE ingesting caffeine. (control group)
All test subjects in the test group ingest the same amount and type of caffeine at the same time of day.
200
What type of data is on the X-axis of this bar graph?
Qualitative data (descriptive categories)
200
This type of graph is best for showing NUMERICAL categories, versus DESCRIPTIVE categories.
Histogram
200
This is another name for the independent variable, and it is graphed on the ____ Axis.
What is manipulated and X-axis?
200
The number of times an experiment is repeated
What are trials?
200
A zoologist studies the relationship between litter size and female weight for dogs. What conclusion can be drawn from the data? (see graph below)
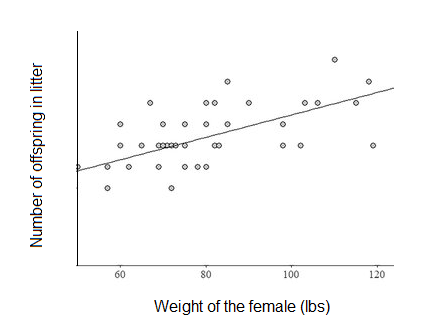
Heavier females are more likely to have larger litter sizes. (positive, direct relationship)
300
The greatest proportion of students received what grade on the test?

B
300
To determine if there is a relationship between variables in a scatterplot, you could draw this
What is a line of best fit?
300
What is the dependent variable in the graph below?
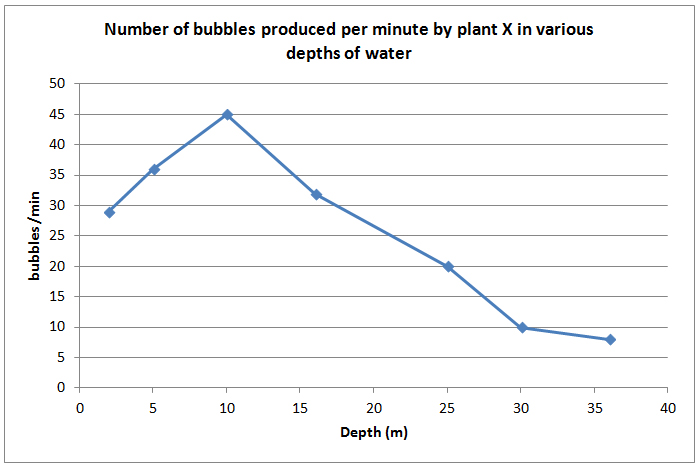
What is bubbles per min?
300
The group of test subjects that don't receive any special treatment; they are used as a basis for comparison.
What is the control group?
300
A pharmaceutical company is testing a new blood pressure medicine. As they conduct their clinical trials, they use people between ages 50-55, with high blood pressure (140/90), who do not have heart conditions. These characteristics represent...
What are controlled variables?
400
Line graphs frequently have which variable on the X-axis?
Time
400
When showing change over time in a line graph, you can do this with the points.
What is connect the dots?
400
The variable in the experiment that is the "effect" - it gets observed or measured
What is the dependent variable (also called responding variable)?
400
The number of independent variables in an experiment
What is ONLY ONE?
400
Which location has the lowest daily ozone concentration?

What is mountain?
500
Which graph below shows a STRONG, DIRECT correlation between the variables?
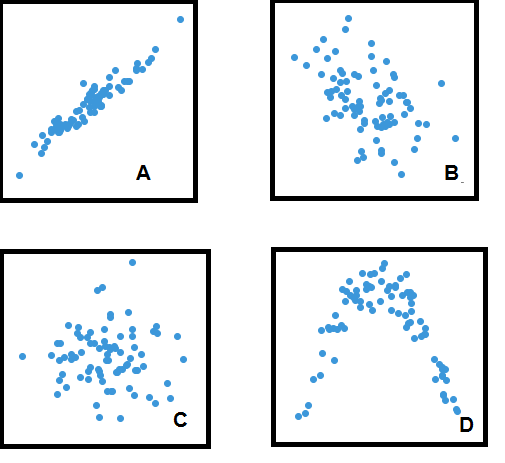
Graph A
500
True or False: Bar graphs provide a quick, visual comparison of groups of data.
True.
500
What is the independent variable in the experiment represented by the graph?

Temperature
500
After a scientist has collected data and analyzed the data, what is the final step?
What is draw a conclusion? (Claim, evidence reasoning?)
500
A wellness clinic conducts a study on the effect of melatonin supplements on sleep quality. The study involves three groups of people. One group does not take any melatonin before bed, a second group takes 20 mg of melatonin before bed and a third group takes 40 mg of melatonin before bed.
Identify the test group(s) in this experiment.
What are the 20 mg and 40 mg groups?