Bar Graphs
Scatter Diagrams
Pie Chart
100
which Shape represents bar graph data
Rectangle
100
what Shape represents scatter diagrams data
Dots
100
Shape representing pie chart data
Circle
200
which fruit is the nicest ?

blueberry
200
What does correlation does this graph have?

Negative correlation
200
Explain what the graph represents

Percentage from total number of students showing each grade
300
What does this graph tell us ?

It shows the comparison between the genre of movies with the people.
300
What does the graph tell us?
Correlation between Car price and salary
300
how much water do we use in shower?
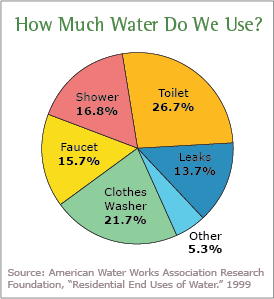
16.8%