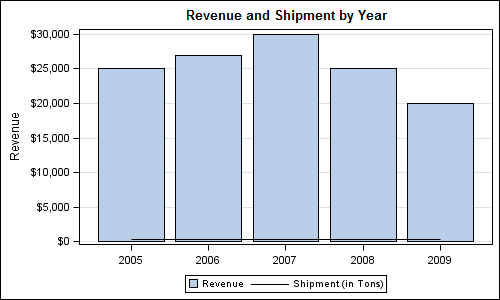
A diagram in which the numerical value of variables are represented by the height or length of columns.
What is a bar graph?

What is a Blueberry?
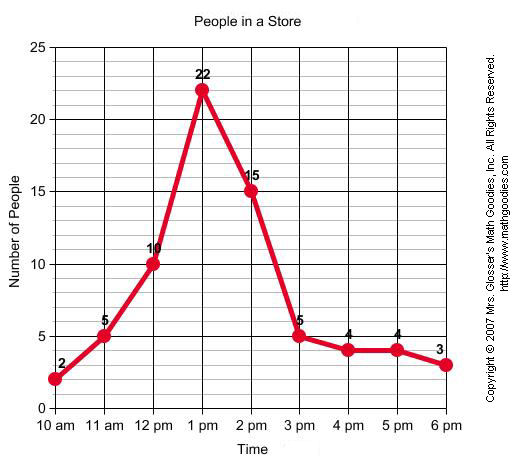
 The most popular time for people to visit the store.
What is 1300 hours.

What is romance?
A graph with points connected by a line to show the change in value over time.
What is a line graph?
 in the year 2000 what sex held the most computer use.
What is males?
 what year had the highest phone sales.
What is 2014?
 what is the largest christian institution.
What is Roman Catholicism?
A type of graph in which a circle is divided into sectors, that represent a proportion of the whole.
What is a Pie Chart?
 The month that holds the most birthdays?
What is June?
 what month repeatedly has the most errors.
What is July?
This type of graph uses coordinates and compares two sets of numbers. On an X and Y axis.
What is a Cartesian Graph?
 Students favorite fruit.
What is a Banana?
 what year had the highest revenue.
What is 2007?
This type of graph, sometimes called a plot, is useful for showing the five number summary.
What is a Box and Whiskers plot?
 The most popular among the children.
What is music?
 what number in thousands was the lowest number of bachelors degrees given per year.
What is 11?