Bar Graphs
Line Plots
Picture Graphs
Tally Charts
Types of Graph
100
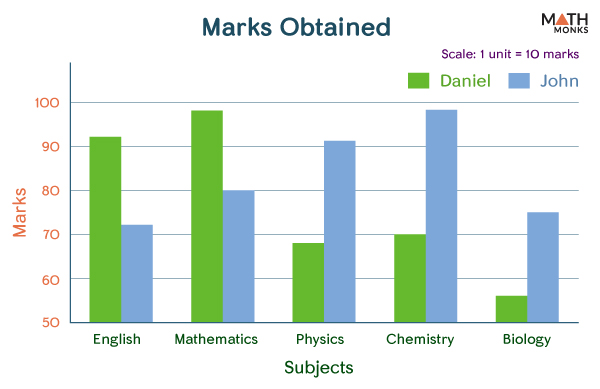
What was John's mark in mathematics?
80
100

This many cars were sold on Monday, Friday, and Saturday.
15
100
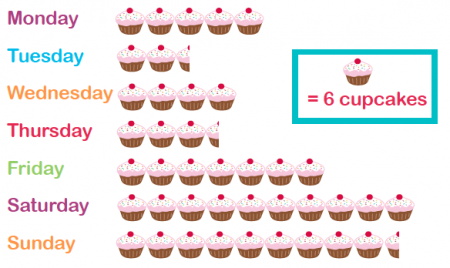
This many cupcakes were eaten on Monday and Wednesday.
Monday = 30 + Wednesday=24=54
100
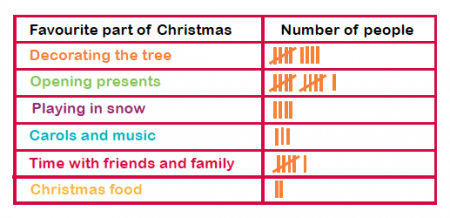
This many people like decorating the tree and playing in the snow during Christmas time.
9+4=13
100
This graph uses bars to show and compare data
Bar Graph
200

How many Grade 3s and Grade 4s both like soccer?
19+29=48
or
18+28=46
200
How many number of students have 5 candy bars?
4
200
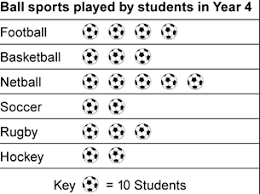
How many students played Rugby?
30
200
How many more students chose baseball than football as their favorite sport?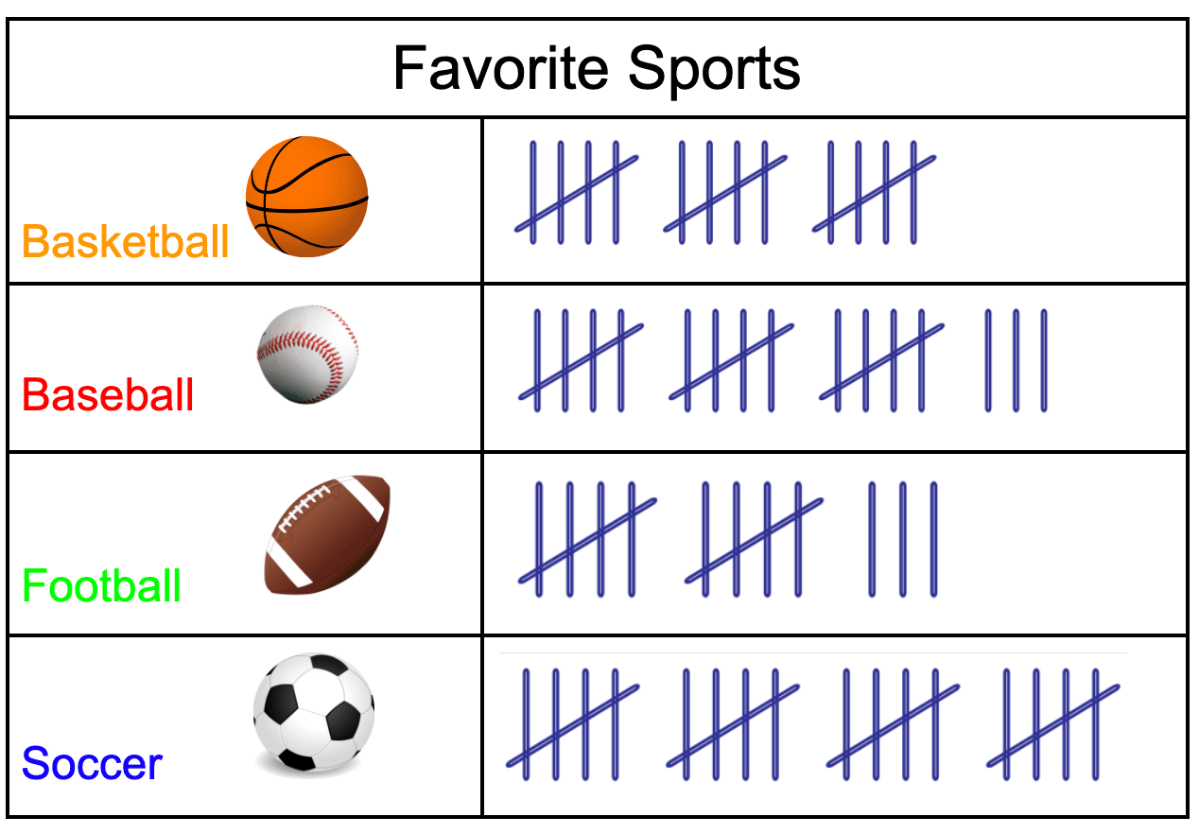
18+13=5
200
This type of graph uses small pictures or symbols to show or compare data.
Pictograph
300

How many votes for popcorn, crackers, cheese and vegetables in total?
popcorn = 5 + crackers=2 + cheese = 7+ vegetables=5
19 votes in total!
300
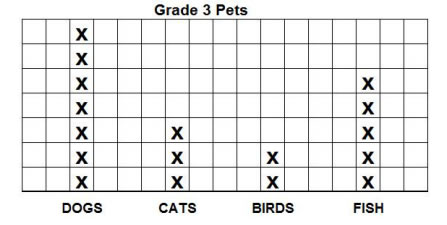
This many more people have dogs and fish than cats.
9
300

How many candies does Sam have?
10
300

How many students like apple, cherry and pineapple?
apple 10 + cherry 17 + 5 = 32
300
This part on a graph shows how much each picture or symbol is
Key
400

How many more students like basketball than golf?
Basketball = 16 - 6 (golf)
10 more students like basketball than golf.
400
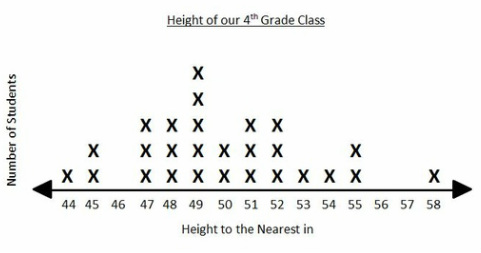
This many students are taller than 47 inches.
21
400

This many more students chose chicken and ice cream than cherry pie.
18
400
What is the most liked colour and what is the least liked colour? (3 answers)
white, blue, and other
400
This type of graph organizes data (numbers) by place value
Stem and leaf plot
500
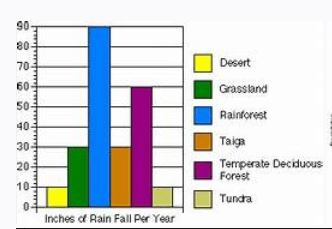
How many inches of rainfall did Grassland get?
30
500
This many more cars were sold on Friday and Saturday than on Monday and Wednesday.
2
500
 How many Johnathan apples are there in the food store?
10+10+10+5= 35
500
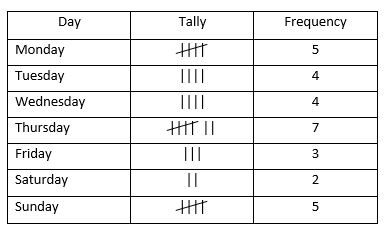
What is missing from this tally chart?
a TITLE!
What would you name the title? (write an answer)
500
This type of graph shows how often (frequency) a certain number occurs in data.
Line Plot