Bar Graphs
Line Plots
Picture Graphs
Tally Charts
100

This number of students have a birthday in February, June, or July.
What is 20?
100

This many cars were sold on Monday, Friday, and Saturday.
What is 15?
100
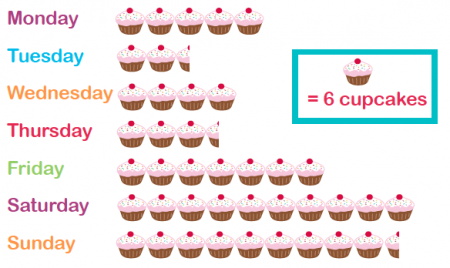
This many cupcakes were eaten on Monday and Wednesday.
What is 54?
100
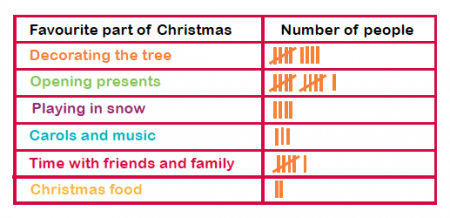
This many people like decorating the tree and playing in the snow during Christmas time.
What is 13?
200
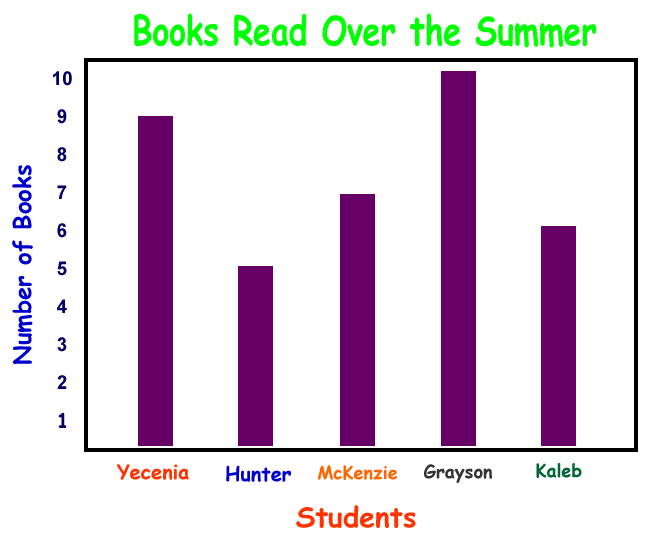
The number of books the students read in all.
What is 37?
200
This many students have at least 5 candy bars.
What is 9?
200
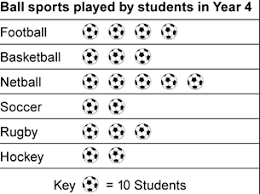
This many students play soccer or basketball.
What is 50?
200

This many students do NOT like Granny Smith apples.
What is 10?
300

This many more students chose fruit and vegetables than cheese and crackers.
What is 5?
300
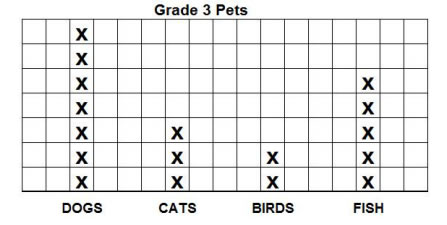
This many more people have dogs and fish than cats.
What is 9?
300

This much candy did was eaten in all.
What is 22?
300
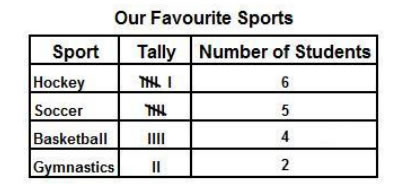
This many more students like hockey and basketball than soccer.
What is 5?
400

This many students voted in all.
What is 22?
400
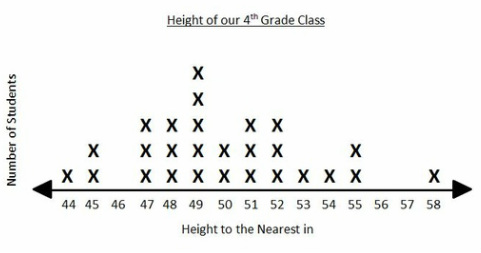
This many students are taller than 47 inches.
What is 21?
400

This many more students chose chicken and ice cream than cherry pie.
What is 18?
400
This many students chose red, blue, or black.
What is 34?
500

This many students did NOT choose cheese as their favorite topping.
What is 60?
500
This many more cars were sold on Friday and Saturday than on Monday and Wednesday.
What is 2?
500

This is how many types of apples are there in all.
What is 150?
500
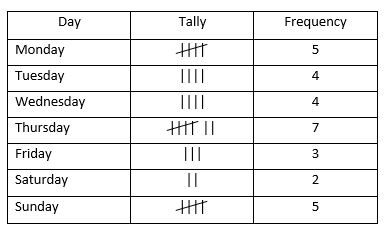
This many students did NOT choose Monday as their favorite day.
What is 25?