Random Graphs :)
Bar Graphs
Dot Plots
Frequency Graphs
Coordinate Plane
100

Which was the least favorite sport?
Ice Hockey
100

How many students like baseball the best?
6 people
100

What is the highest number of dots?
5
100

What is the frequency of students who have 5 siblings?
1 student
100
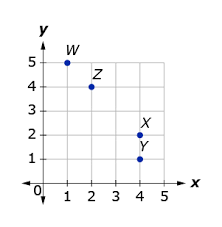
Name the coordinate pair for point Z
(2,4)
200

What was the most favorite fruit?
Peach
200
How many people picked hockey and tennis?
7 people
200
What two numbers have the same number of dots?
3 and 7
200
What is the frequency of students with two siblings?
6
200
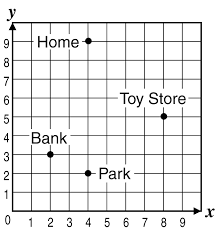
Name the coordinate pair for "home"
(4,9)
300
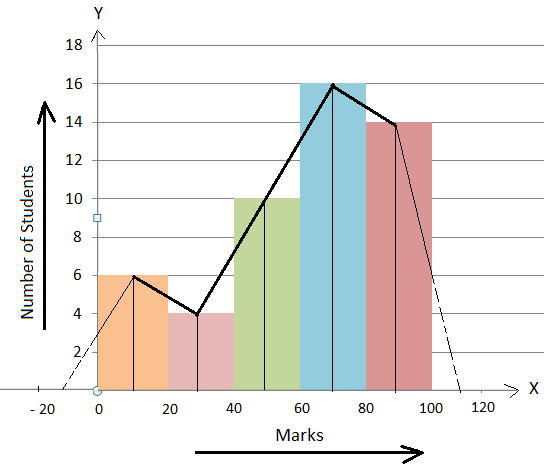
How many students scored 20 - 40 marks?
4 students
300
How many more students like Soccer than Basketball?
9 - 7 = 2 students
300
What is the RANGE?
7 - 3 = 4
300
What is the total number of people asked about their siblings?
18
300
(0,0) is called the what?
Origin
400
 Which method of music sales has increased AND decreased over time?
Downloads
400
What is the most favorite sport?
SOCCER
400
What is the total number of dots?
15
400
What is the most common number of siblings?
2 Siblings is the most common score
400
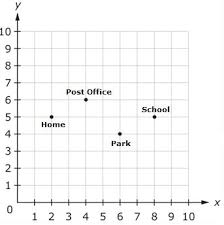
To get from "home" to the "post office" how do I move?
Over 2, up 1
500
 In your own words, compare the two dot plots (i.e describe what you see and compare the two graphs, what is the relationship)
The dot plots are almost opposite.
The dot plots show that most students exercise less than 4 hours.
Most play video games more than 6 hours each week.
Students are spending more time playing video games than they are exercising.
500
How many people picked a favorite sport that is played on a court?
12 people
Basketball and Tennis are played on courts, the others are played on fields or pitches
500
What is the difference between 5 and 3?
6 - 1 = 5
500
How many students have 3 or more siblings?
7 students
500
 List ALL the ordered pairs for W, X, Y Z
(1,5), (4,2), (4,1), (2,4)