Random Graphs :)
Bar Graphs
Dot Plots
Frequency Histograms
Circle Graphs
100

Which was the least favourite sport?
Ice Hockey
100

How many students like baseball the best?
6 people
100

How many dots are in row 5
6
100

What is the frequency of students who have 5 siblings?
1 student
100

What is this graph about?
Favorite Pizza Toppings
200

What percentage of people liked grapes and bananas?
57%
200
How many total people completed the survey?
29 people
200
How many more dots are in row 5 than row 6?
2
200
What is the frequency of students with two siblings?
6
200
How many students like Cheese
25%
300
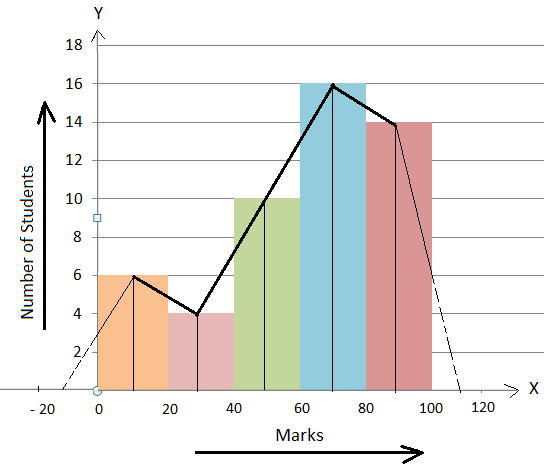
How many students scored 40 marks or below?
10 students
300
How many more students like Soccer than Basketball?
9 - 7 = 2 students
300
How many dots do you see?
15
300
How many total siblings?
18
300
How many students like Supreme
10%
400
What is the most favorite sport?
SOCCER
400
What is the last number on the graph
11
400
What number do you see more on the frequency side?
1
400
How many students like Pepperoni
50%
500
How many people voted?
29 people
500
Does row 4 and 3 have more dots than row 6 and 7 ?
no
500
How many students have 3 or more siblings?
7 students
500
What toppings do students like the most?
Pepperoni