Tally Chart/Tables
Bar Graphs
Line Graphs
Pictographs
100

How many licorice jellybeans are represented in this tally chart?
6
100

How many people prefered Comedy movies?
4 people
100

Oh what two days were the same number of cookie packs sold? How many were sold on those days?
On _____ and _____, #__ cookie packs were sold.
On Wednesday and Thursday, 6 cookie packs were sold.
100
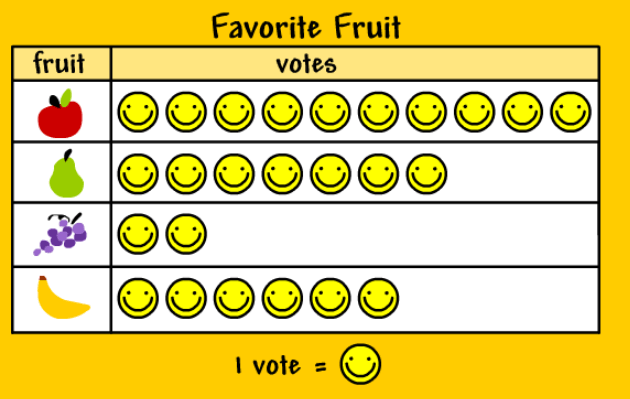 What is the most popular fruit?
Apples
200

How many more people took a bus than took a car?
3
200
How many people preferred Action movies?
5 people
200

What information is shown in this graph?
The number of ice creams sold on five different days.
200
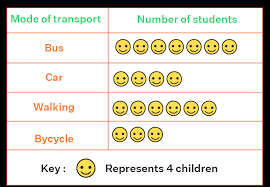
How many children took a car?
16
300
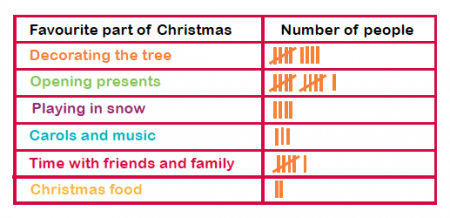 How many people were asked about their favorite part of Christmas?
35 people
300

In what two months were 7 people born?
Sep and Dec
(September and December)
300
How many ice creams were sold on Sunday?
36
300
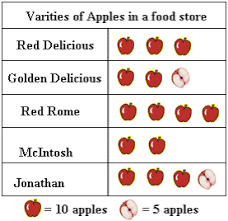
How many more Jonathan apples were there than Golden Delicious apples?
15
400

How many more girls are there than boys in Ms. Williams' class?
21
400
What is the difference between the month with the most birthdays and the month with the least birthdays?
9 people
400

During which 1-day period did the temperature increase the most?
From day ___ to day ___.
From day 1 to day 2.
400

How many more hours were spent on sleep than on online classes?
6 hours
500
How many boys are there in the entire 3rd grade?
48
500

How many people were asked their favorite sport in order to make this graph?
29 people
500
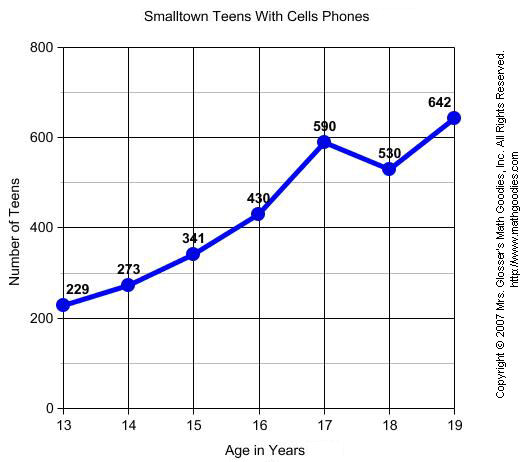
What is the difference between the number of 18-year-olds and 14-year-olds with cell phones?
257
500

How many children voted for either pepperoni pizza or cheese pizza?
24