Random Graphs :)
Bar Graphs
Dot Plots
Frequency Histograms
Circle Graphs
100

Which was the least favorite sport?
Ice Hockey
100

How many students like baseball the best?
6 people
100

How many dots are in row 5
6
100

What is the frequency of students who have 5 siblings?
1 student
100
 What is the least popular subject?
Science
200

What percentage of people liked grapes and bananas?
57%
200
How many total people completed the survey?
29 people
200
How many more dots are in row 5 than row 6?
2
200
What is the frequency of students with two siblings?
6
200
What uses the most water?
Toilet
300
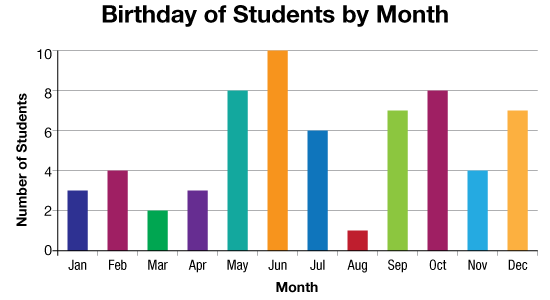
How many students are born in November?
4 students
300
How many more students like Soccer than Basketball?
9 - 7 = 2 students
300
How many dots are there between 2 and 5 (not counting 5)?
4
300
How many total siblings?
18
300
 What is the total percent of people that like SciFi and Comedy COMBINED?
40%
400
How many students born in November and April Combined?
7
400
What is the most favorite sport?
SOCCER
400
What is the last number on the graph? (hint; 0 is your first number)
11
400
What number do you see more on the frequency side?
1
400
 How many more people like Football than Hockey?
20%
500
How many students were surveyed?
15
500
How many people picked a favorite sport that is played on a court?
12 people
Basketball and Tennis are played on courts, the others are played on fields or pitches
500
Does row 4 and 3 have more dots than row 6 and 7 ?
no
500
How many students have 3 or more siblings?
7 students
500

If 100 people were surveyed, how many people liked Peaches?
40