Mixed bag Graphs
Bar Graphs
Dot Plots
Frequency
Pie Chart Graphs
100

Which was the least favourite sport?
Ice Hockey
100

How many students like baseball the best?
6 people
100

What is the MODE?
5
100

What is the frequency of students who have 5 siblings?
1 student
100

What percent of people like PIZZA?
100%
200

What percentage of people liked grapes and bananas?
57%
200
How many total people completed the survey?
29 people
200
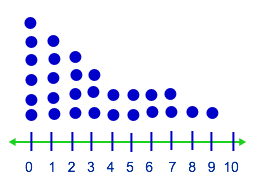
How many people responded with an answer of 4 or less?
4
200
What is the frequency of students with two siblings?
6
200

This circle graph represents a classroom of 20 students. How many students chose pepperoni pizza?
clue: 50% is half of 20 students
10 students
300
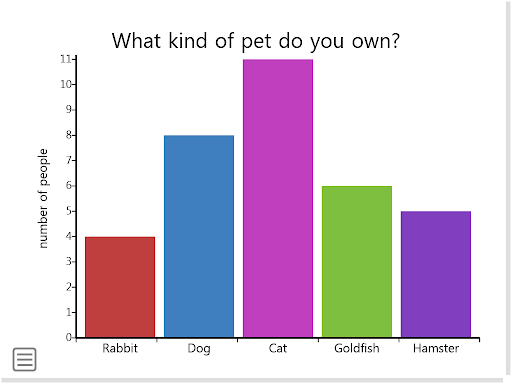
How many students own dogs?
8 students
300
How many more students like Soccer than Basketball?
9 - 7 = 2 students
300

How many families here would have at least one middle child in their family?
5
300
How many people were surveyed?
18
300
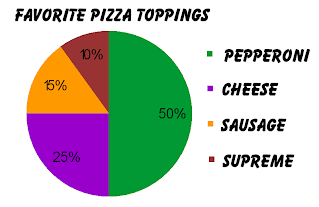
This circle graph represents a class of 20 people. How many people chose CHEESE pizza?
5 people
400
What are ALL names possible modes?
Unimodal, bimodal, trimodal, multimodal
400
What is the most favorite sport?
SOCCER
400
What What is the mode?
2
400
What is the MODE for this data?
2 Siblings is the mode (the most common score)
400

This circle graph represents 20 people. How many more people chose pepperoni compared to cheese?
10-5 = 5 students
500
 In your own words, compare the two dot plots (i.e describe what you see and compare the two graphs, what is the relationship)
The dot plots are almost opposite.
The dot plots show that most students exercise less than 4 hours.
Most play video games more than 6 hours each week.
Students are spending more time playing video games than they are exercising.
500
How many people picked a favorite sport that is played on a court?
12 people
Basketball and Tennis are played on courts, the others are played on fields or pitches
500
Give a possible title for this dot plot.
Answers will vary
500
How many students have 3 or more siblings?
7 students
500

What percentage of people preferred meat based pizzas?
50 + 15 + 10 = 75%