Random Graphs :)
Bar Graphs
Dot Plots
Frequency Histograms
100

What percentage of people liked grapes and bananas?
57%
100

How many total people completed the survey?
29 people
100

How many more dots are in row 5 than row 6?
2
100

What is the frequency of students with two siblings?
6
200
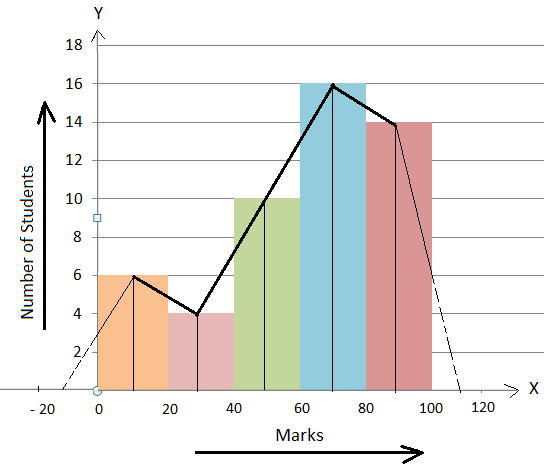
How many students scored 40 marks or below?
10 students
200
How many more students like Soccer than Basketball?
9 - 7 = 2 students
200
How many dots do you see?
15
200
How many total siblings?
18
300
How many students scored 60 marks or more?
30
300
What is the most favorite sport?
SOCCER
300
What is the last number on the graph? (hint; 0 is your first number)
11
300
What number do you see more on the frequency side?
1
400

How many students were surveyed?
15
400
How many people picked a favorite sport that is played on a court?
12 people
Basketball and Tennis are played on courts, the others are played on fields or pitches
400
Does row 4 and 3 have more dots than row 6 and 7 ?
no
400
How many students have 3 or more siblings?
7 students