Random @_@
Bar Graphs
Dot Plots
Histograms
MMMR
100

Which was the least favourite sport?
Ice Hockey
100

How many students like baseball the best?
6 people
100

How many dots are in row 5
6
100

How many people from the ages 16-20 found M&M's to be their favorite candy?
50
100
5, 15, 7, 8, 10
What is the mean?
9
200

What percentage of people liked grapes and bananas?
57%
200
How many total people completed the survey?
29 people
200
How many more dots are in row 5 than row 6?
2
200
How many people people were surveyed?
185
200
5, 15, 7, 8, 10
What is the median?
8
300
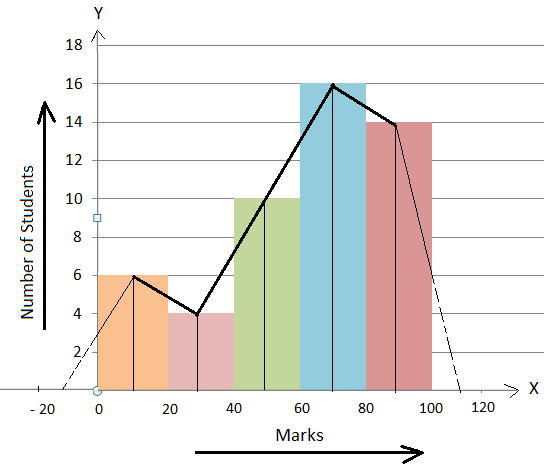
How many students scored 40 marks or below?
10 students
300
How many more students like Soccer than Basketball?
9 - 7 = 2 students
300
How many dots do you see?
15
300
How many more people 26-30 years old found M&M's to be their favorite candy than 0-5?
20
300
5, 15, 7, 8, 10
What is the mode?
None
400
How many students were surveyed?
15
400
What is the most favorite sport?
SOCCER
400
What is the last number on the graph
11
400

How many students scored A's in math class?
2
400
5, 15, 7, 8, 10
What is the range?
10
500
How many more students play soccer than baseball?
1
500
How many people picked a favourite sport that is played on a court?
12 people
Basketball and Tennis are played on courts, the others are played on fields or pitches
500
Does row 4 and 3 have more dots than row 6 and 7 ?
no
500
How many students failed math?
12
500
5, 5, 5, 6, 6, 7, 7, 7, 8, 8
What is the mode?
5 and 7