Random Graphs :)
Bar Graphs
Dot Plots
Frequency Histograms
Steam and Leaf
100

What percentage of people liked grapes and bananas?
57%
100

How many total people completed the survey?
29 people
100

How many more dots are in row 5 than row 6?
2
100

What is the frequency of students with two siblings?
6
100
 How many students scored between 80% and 90%?
7 students.
200
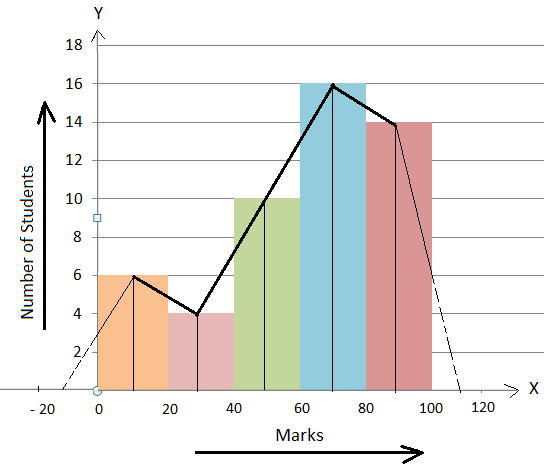
How many students scored 40 marks or below?
10 students
200
How many more students like Soccer than Basketball?
9 - 7 = 2 students
200
How many dots do you see?
15
200
How many total siblings?
18
200
 How many Students got 100% on the Math test?
2 students.
300
How many students scored 60 marks or more?
30
300
What is the most favorite sport?
SOCCER
300
What is the last number on the graph? (hint; 0 is your first number)
11
300
What number do you see more on the frequency side?
1
300

What is the mode?
89
400

How many students were surveyed?
15
400
How many people picked a favorite sport that is played on a court?
12 people
Basketball and Tennis are played on courts, the others are played on fields or pitches
400
Does row 4 and 3 have more dots than row 6 and 7 ?
no
400
How many students have 3 or more siblings?
7 students
400
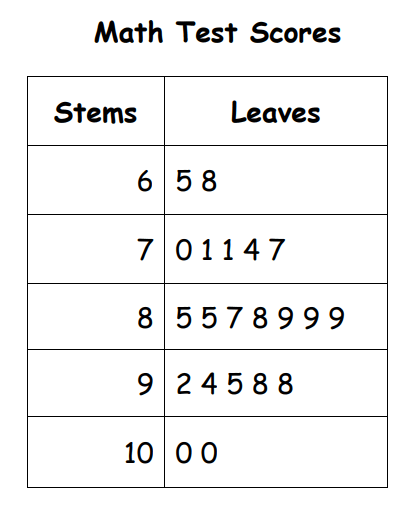 How many students go above 70% on the science test?
No idea. The Stem and Leaf shows Math Test Scores