Reading Line Plots
Reading Data Sets
Whole Number Line Plots
Graph Info
Misc
100
Use the following line plot to answer the question:
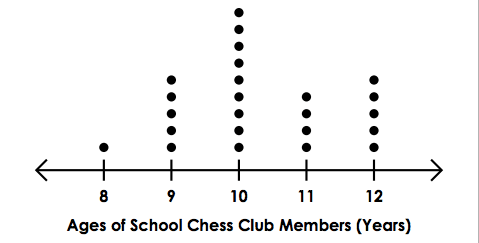
What is the most common age?
10 years old
100
What is an Outlier?
A piece of data that is separate from the rest of the data.
100
Use the following line plot to answer the question:
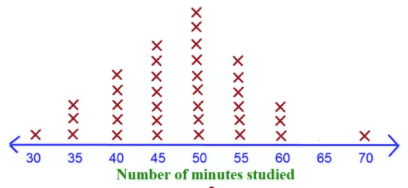
What was the LEAST common number of minutes studied?
30 and 70 minutes.
100
What is another name numbers as it relates to graphs
What is a data set
100
What is the mode of this data set?
1, 5, 10, 15, 17, 15, 8, 18
15
200
Use the following line plot to answer the question:

What is the Age of the youngest Chess Club Member?
8 years old
200
Look at the following data set:
8, 6, 5, 5, 3, 4, 3, 6, 7, 5, 6, 7, 8
On a number line, how many X's would be placed above the number 5?
3 X's
200
Use the following line plot to answer the question:
What is the most common age?
10
200
A line plot uses what above the number line to show how often a value occurs
What is an x
200
What are the four types of graphs we have studied?
Picture, line, bar and line plot
300
Use the following line plot to answer the question:
What is the age of the oldest Chess Club Member?
12 years old
300
Look at the following data set:
8, 6, 5, 5, 3, 4, 3, 6, 7, 5, 6, 7, 8
Which number is the LEAST common?
4
300
Use the following line plot to answer the question:
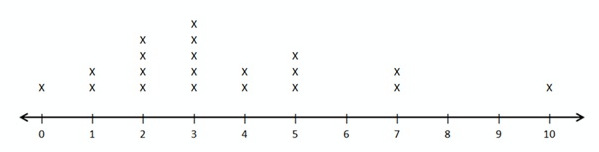 Is there an outlier in this lineplot? If so, what is the outlier?
Yes, 10
300
A line plot graph does not have a title to inform the reader of the value of each x
False
300
When finding the mean of a data set do I have to put the numbers in order form least to greatest
No
400
Use the following line plot to answer the question:
How many Chess Club Members are younger than 11 years old?
15 Chess Club Members
400
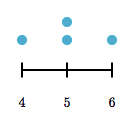
Make a line plot using the following data set:
5, 4, 5, 6
400
Use the following line plot to answer the question:
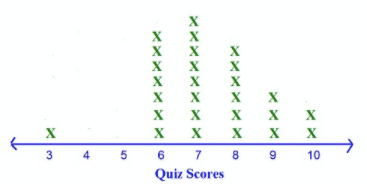
How many people scored higher than 7 on the quiz?
11
400
To _________ is to collect data by asking multiple people the same question.
survey
400
What is the name of the chart that uses sticks or marks to represent numbers?
Talley char
500
Use the following line plot to answer the question:
How many total members are in the Chess Club?
24 Members
500
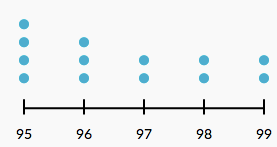
Make a line plot using the following data set:
99, 97, 95, 96, 95, 95, 96, 95, 99, 98, 98, 97, 96
500
Use the following line plot to answer the question:
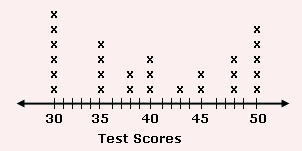
What is the difference between the highest and the lowest test scores?
50 - 30 = 20
500
Do line graphs have a key
yes
500
What is the mean of this data set
5, 6, 8, 4, 7, 3, 2, 1, 2, 2
The mean is 4