Describe that Graph
Box Plots
MMMR
Describing Variability/Data
Get to know your group
100
What is this graph?
Histogram
100
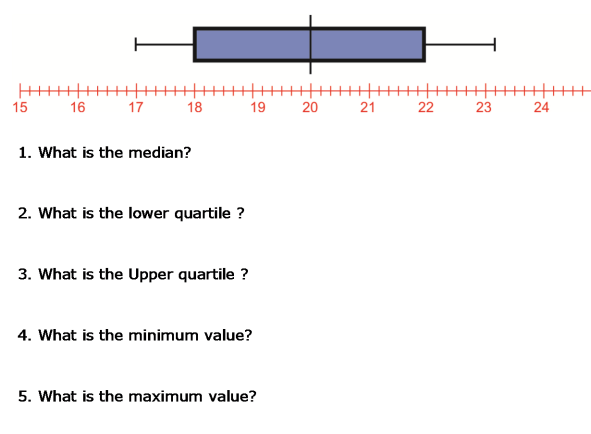
 DDescribe the shape of the box blot.
skewed left
100
What is the Median and how do you calculate it?
The middle, cross out method
100
When you have a boxplot, what can you look at to determine spread? (variability)
IQR
The box
The range
100
What is the AVERAGE number of siblings the students have in your group?
Describe the steps you took to get the answer.
answers vary
Students should explain mean/ average and explain either calculating it mentally, with a yellow calculator or with desmos.
200
What is the graph?
DotPlot
200
What is the Median?

40
200
What is Mean and how do you calculate it?
Add up values then divide by how many numbers
200
Can you find the mean and median of a histogram?
Why or why not?
No- in a histogram you have intervals of data, but not specific data.
200
What is the MEDIAN shoe size in your group?
Explain how got your answer.
Answers vary
Students should describe either calculating median by hand or with desmos
300
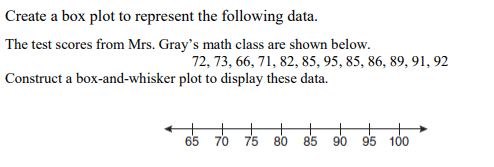
What is the graph?
Box and Whisker Plot
300
What is the IQR?
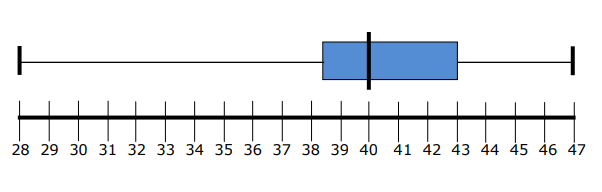
38 to 43
43 - 38 = 5
300
Find the Mean, Median:
3, 6, 9, 3, 2, 0, 0, 6
Mean: 3.625
Median: 3
300
What are 2 data points to consider when talking about variability of data ?
IQR
Standard Deviation
300
What is the maximum number of times you can flip the cup in 1 minute?
answers vary
400
Describe the shape of the graph
skewed right
400
400
What is the Mean?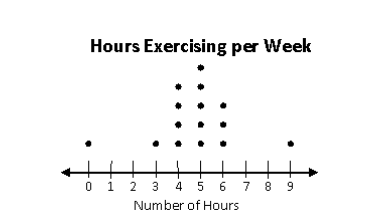
67/15
4.4
4.46
4.47
400
Describe the SPREAD/Variability in the Histogram
This is symmetric, most data points are in the center or close to the center. There is not much variability in the data.
400
What is the RANGE of the number of pets in your group?
Maximum- Minimum
500
Create a Dot Plot that is BIMODAL and SYMMETRICAL
500
(use desmos)
500
What is the MEDIAN?

Median: 2 gallons
500
Calculate the STANDARD deviation:
3,6,6,9,10,21,33,4,0,7
How variable is the data in this list?
(use desmos)
500
Create a boxplot using the number of times you can flip the cup in 1 minute.
Everyone in the group should flip the cup twice, and use BOTH numbers in your data set.
Answers vary
Students are allowed to use desmos.