Proportionality
Scale copies
Scale Drawing
100
The order pairs (1, 5) and (2, 10) are on a graph. Does this graph represent a proportional relationship? How do you know?
Yes, because the COP is 5
100
What scale factor was applied to Figure A to create create Figure B?
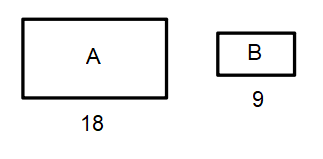
9/18 = 1/2
100
On a map, 1 inch = 70 miles. How many miles are represented by 5 inches?
350 miles
200
Which table or ordered pairs represents a proportional table? Justify your answer using one piece of evidence. Write TWO equations for the proportional table.

D is the only one that has the same unit rate.
x = 5y
y = 1/5x
200
What scale factor was used to create Figure B?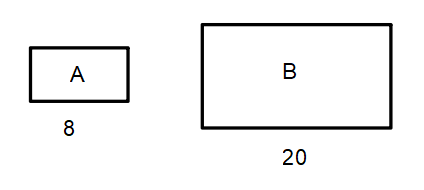
scale copy= 20, original = 8
20/8 =2.5
200
On a map, 1 inch = 20 miles. How many inches are represented by 100 miles?
5 inches
300
Write an equation that represents the relationship between H, hours worked and D, dollars earned.
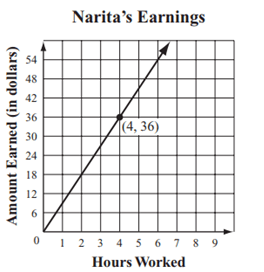
D = 9h
300
*DAILY DOUBLE* A scale factor of 2 was applied to rectangle A to create rectangle B. What is the area of rectangle B? 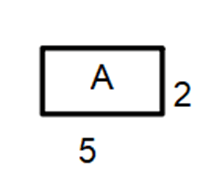
5*2 = 10, AND 2*2 = 4
10*4 = 40 units squared
Originalareaxscalefactorx scalefactor=scaled area
10 x 2 x 2 = 40 units squared
300
On a map, 5 inches = 200 miles. How many miles are represented by 7.5 inches?
300 miles