Sampling/Data/Descriptive Statistics
Box Plots/Cumulative Frequency Graphs
Linear Regressions/ Pearson's/Spearman's Rank
Miscellaneous Review
Acosta Trivia
100
A student collects data on how many times each student goes to the gym each week. Name 2 descriptors for this data.
Quantitative and discrete (can also accept primary)
100
A box plot shows which 5 key features?
minimum, lower quartile, median, upper quartile, maximum
100
Write the equation for a linear regression for this data:
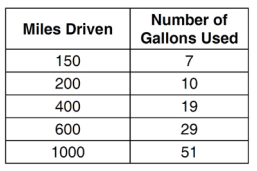
y = 0.05x − 0.92
100
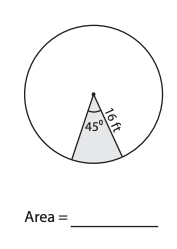
100. ft^2
100
How long has Ms. Acosta been at St. George's?
Since last year
200
A supermarket supervisor wants to know more about how customers like the layout of the store. She asks every 5th person who walks in. What method of sampling is this?
Systematic.
200
What is the interquartile range for this data?
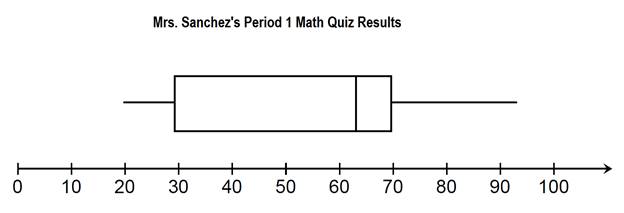
40
200
A student weights his puppy (in kg) every day and then creates a linear regression to model the puppy's weight over time. His regression is y = 0.1x + 4.5
Explain what 0.1 means in this context and what 4.5 means in this context.
The puppy gains 0.1 kg of weight every day. When the puppy was born he weighed 4.5 kg.
200
Jack cycles 5km his first day and then increases his distance by 13% each day. How far will Jack (theoretically) run on day 30?
173 km.
200
What subject did Ms. Acosta teach last year in addition to Math?
CSC
300
Find the mean, median, and mode of this data:
4, 4, 4, 4, 7, 8, 8, 9, 9, 9
Mean: 4.1
Median: 7.5
Mode: 4
300
Estimate the median height from this cumulative frequency graph:

4.6 m
300
Which set of data has a stronger correlation and how do you know?
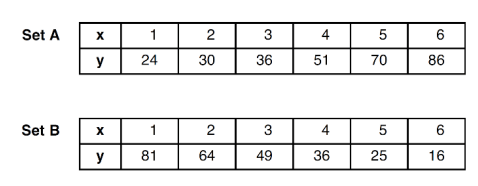

300
Lisa is trying to buy a new $14,000 car. The bank is willing to make her a loan for the full $14,000. It's a 6 year loan with a nominal interest rate of 14% compounded quarterly. She will also make payments quarterly.
Find the repayment to be made each quarter.
$871.82
300
Ms. Acosta is from which US state?
Illinois
400
What is the median score?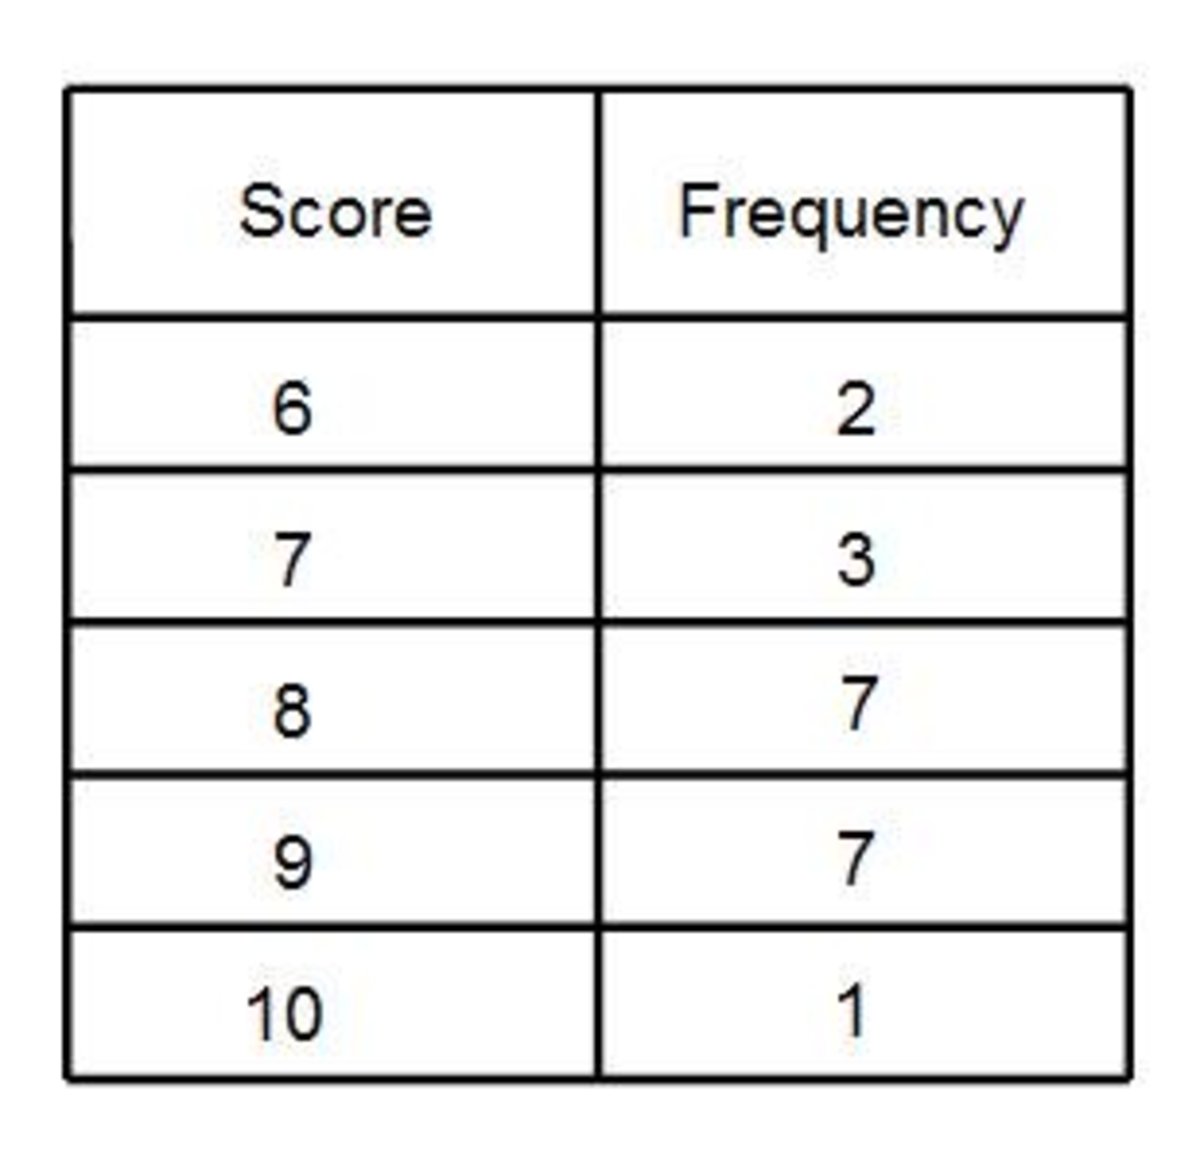
Median: 8
400
Estimate the percentage of trees that were between 3 and 8 meters tall.
60/70 * 100 = 85.7%
400
A certain set of data has a Pearson's product-moment correlation coefficient of r = 0.75 and a Spearman's rank correlation coefficient of r = 0.97. What does this tell you about the data?
The data has a strong non-linear correlation. AND/OR There is a monotonic relationship between the variables.
400
Find the location of the missing site on this Voronoi Diagram
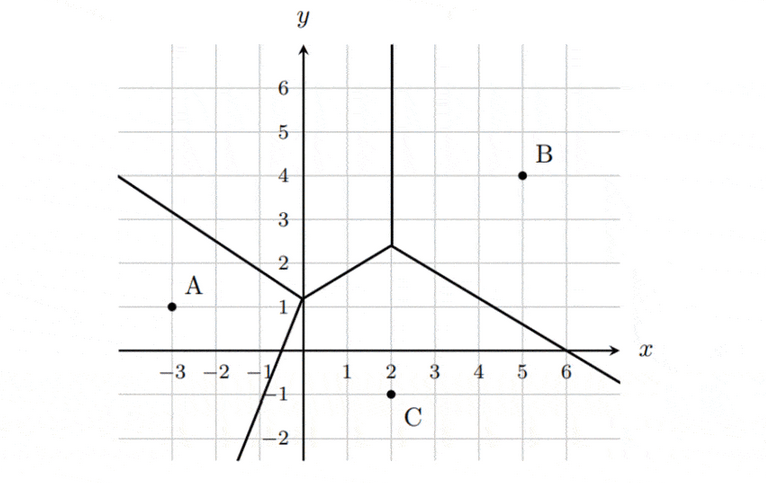
(-1, 4)
400
How many siblings does Ms. Acosta have?
3 (2 brothers and 1 sister)
500
Use the following information to find the values in a dataset:
- There are 5 numbers
- The minimum is 10
- The range is 20
- The mode is 19
- The mean is also 19
10, 17, 19 , 19, 30
500
Given the dataset below, show that 27 is an outlier.
3, 4, 4, 5, 6, 7, 7, 8, 27
IQR = 7.5 - 4 = 3.5
upper bound: Q3 + (1.5*IQR) = 7.5+(1.5*3.5) = 12.75
27>12.75 therefore it is an outlier
500
Find Spearman's rank correlation coefficient for this data:
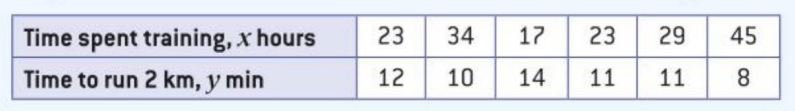
r = -0.956
500
Find the equation of the edge between cell A and D in this Voronoi diagram:
y=-2/3x+7/6
500
What is Ms. Acosta's favorite color?
Green