Type of data: Names, places, shapes, colors, etc.
Categorical data
How many BMX Bikes were sold?
17
Simplify:
6/11 x 5/6
5/11
write 36000 in standard form
3.6 x 10⁴
simplify 3x(2x + 5)
6x2 + 15x
Type of numerical data: Number of students, number of pets, shoe size, goals scored
Descrete
How many more people live in Egypt in 2019 compared to 2000?
35 million
Convert 7/25 to a percent
28%
write 8.06 x 10⁻⁶ in ordinary form
0.00000806
Solve
-5(n - 6)=-20
n=10
What is this called?

Frequency table
The ages of males and females are shown in the plot. What is the age of the oldest female?
96
2 5/8 - 1 3/4
7/8
write 0.0004173 in standard form correct to 2 significant figures
4.2 x 10⁻⁴
solve
3(x + 1)=2(x + 1) + 2x
x=1
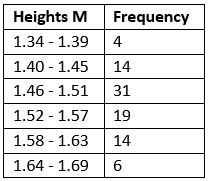
How many people surveyed are taller than 1.52m?
33
The pie chart shows the colors of 32 different beads. How many were green?
8
3 1/5 ÷ 5 2/3
48/85
simplify and leave your answer in standard form, correct to 2 significant figures:
(4.9 x 105) x (3.6 x 109)
1.8 x 10¹³
Factorise
7x3y - 14x2y2 + 21xy2
7xy(x2 - 2xy + 3y)
Give an example of qualitative data
270 ice cream flavors were sold in total. How many were vanilla?
45
The number of employees increased from 45 to 92 last year. Calculate the percent increase
104%
The population of a country changed from 3.5 x 10⁵ to 2.9 x 10⁵. Calculate the percent decrease.
17.1%
make y the subject:
x/√y = c
y=(x/c)2


