Slope-Intercept Form
Point-Slope Form
Correlations
Lines of Best Fit
Predictions
100
Write the equation of the line in slope-intercept form.
Slope: -2
Y-intercept: (0,-3)
y=-2x-3
100
Write the equation of the line in point-slope form.
Slope: -3
point: (-2 , 1)
y-1=-3(x+2)
100
Describe the correlation as positive, negative, or no correlation.
Negative Correlation
100
Which graph that demonstrates a good line of fit?
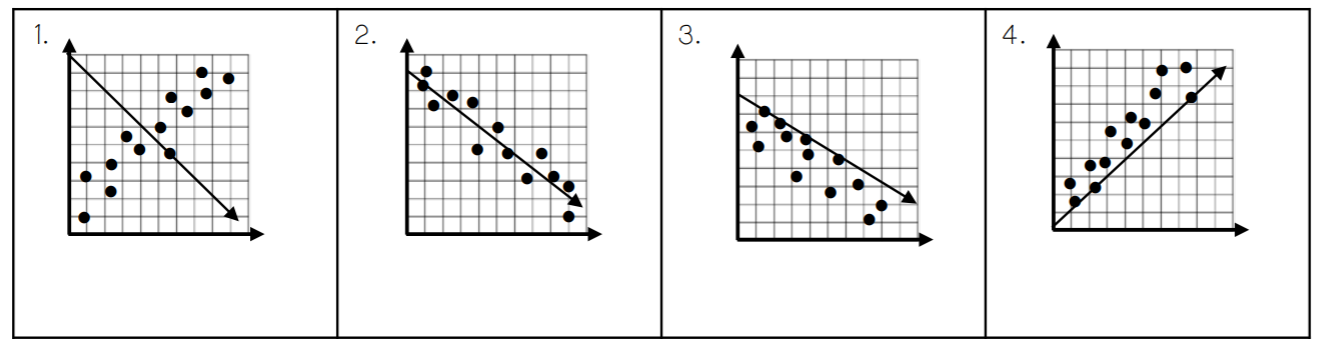
Graph 2
100
The equation y=11x+12 represents the number of retail stores in a city over the years where x represents the years since 1990 and y represents the number of stores.
Find the number of stores in 1990.
In 1990, there are 12 stores.
200
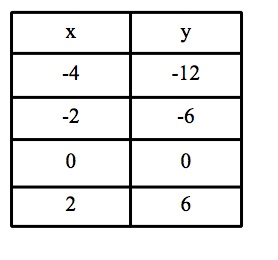
Write the equation of the line in slope-intercept form.
y=2x+4
200
Write the equation of the line in point-slope form.

y-4=1/3(x-3)
or
y-9=1/3(x-9)
200
Interpret the correlation coefficient
r = 0.312
Weak, positive correlation
200
The slope of the line of best fit.

m= 12.5 or 25/2
200
The equation y=11x+12 represents the number of retail stores in a city over the years where x represents the years since 1990 and y represents the number of stores.
Find the number of stores in 2010.
In 2010, there are 232 stores.
300
Write the equation of the line in slope-intercept form.
Slope: 4
Point: (-2, 4)
y=4x+12
300
Write the equation of the line in point-slope form.
y+12=3(x+4)
y+6=3(x+2)
y-0=3(x-0)
y-6=3(x-2)
300
Interpret the correlation coefficient
r = -0.789
Moderate, negative correlation
300
Write the equation of the line of best fit (in slope-intercept form).

y=-1/3x+8
300
The equation y=11x+12 represents the number of retail stores in a city over the years where x represents the years since 1990 and y represents the number of stores.
Find the year there were 133 stores.
In 2001, there were 133 stores.
400
Write the equation of the line in slope-intercept form.
(-1 , -9) (1 , -3)
y=3x-6
400
Write the equation of the line in point-slope form.
(-4, 1) (4, -1)
y-1=-1/4(x+4)
y+1=-1/4(x-4)
400
Describe the correlation as positive, negative, or no correlation.
The weight (in pounds) of a baby over time (in months).
Positive correlation
(As time increases, the baby's weight increases)
400
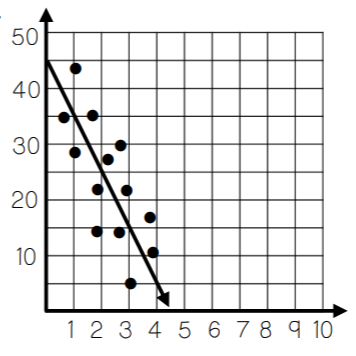
The graph shows the percentage of the U.S. population that smokes cigarettes each year since 1960. Interpret the y-intercept of the line of best fit in context.
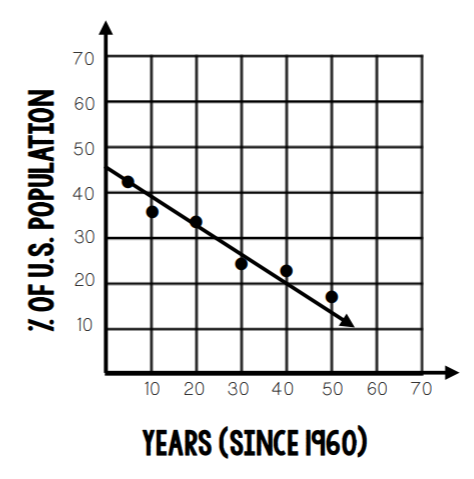
In 1960, 45% of the U.S. Population smoked cigarettes.
400
The equation y=11x+12 represents the number of retail stores in a city over the years where x represents the years since 1990 and y represents the number of stores.
Interpret the meaning of the coordinate (2,34)
In 1992, there are 34 stores.
500
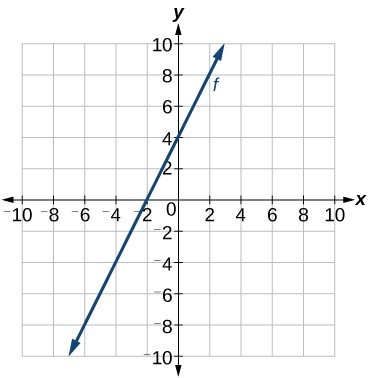
Write the equation of the line in slope-intercept form.
f(1) = -2
f(3) = 2
f(x)=2x-4
500
Write the equation of the line in point-slope form.
f(-2)=1
f(1)=7
y-1=2(x+2)
y-7=2(x-1)
500
Describe the correlation as positive, negative, or no correlation.
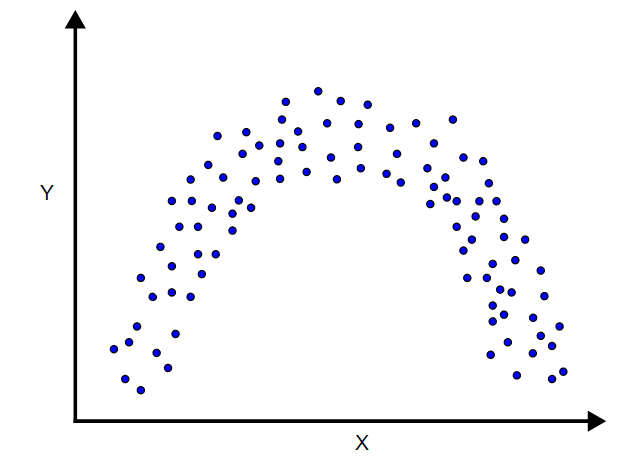
No Correlation (This is a non-linear correlation)
500
Interpret the slope in the context of this situation (Be Specific!)
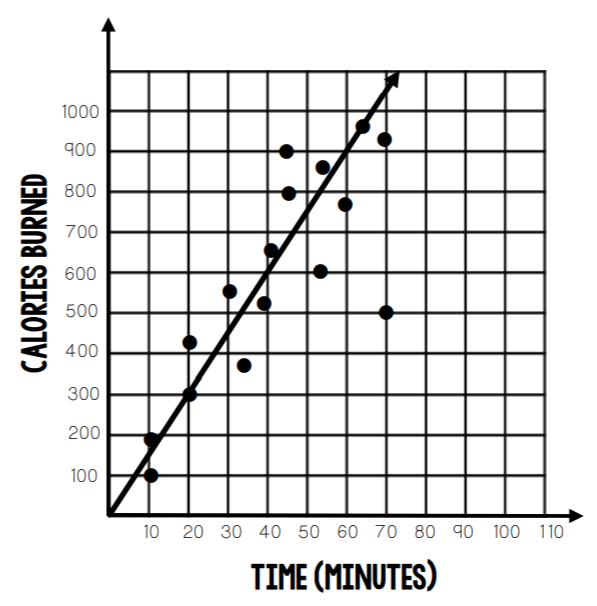
You burn 15 calories every minute.
500
The equation y=11x+12 represents the number of retail stores in a city over the years where x represents the years since 1990 and y represents the number of stores.
Determine what residual the point (3,16) will have (positive, negative, or none)?
The point (3,16) will have a NEGATIVE residual since the number of stores is fewer than predicted.