Study Types
Definitions
Normal Distribution
Histograms
100
How do business customers feel about the level of support they receive? The business randomly selects 200 customers and asks them to share their opinions
Survey
100
A study that collects data by directly influencing something to determine how another thing is changed.
An Experimental Study
100
A distribution is approximately normal with a mean of 18 and a standard deviation of 4. What percentage of data falls between 14 and 22?
Approx. 68%
100
How many data points are here?
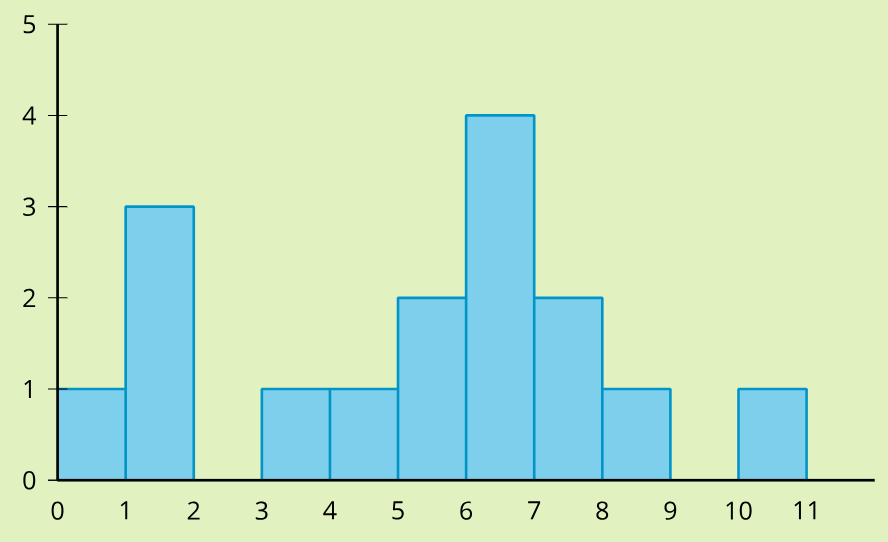
16
200
Elena is interested in whether music affects plant growth. For a science fair project, she will grow one plant in a room that is normally kept quiet. She will grow another plant in another room that has classical piano music playing all the time. After 2 months, she compares the height of the plants to determine the effect of music on plant growth
Experimental Study
200
A selection process by where each item in a set has an equal probability of being selected.
A Random Selection
200
A distribution is approximately normal with a mean of 18 and a standard deviation of 4. What percentage of data falls between 10 and 26?
Approx. 95%
200
True/False. This histogram shows a normal distribution
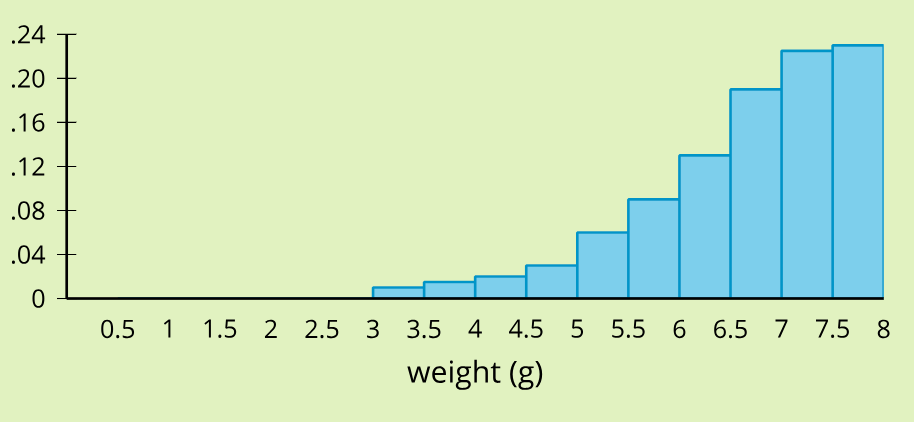
False (skewed left)
300
Do truck drivers get into more accidents than people who drive SUVs? Researchers use police records of automobile accidents over the past year and vehicle registrations to compare the percentage of drivers of vehicles of each type that get into accidents
Observational study
300
A set of questions given to people to seek their responses.
A survey
300
A distribution is approximately normal with a mean of 18 and a standard deviation of 4. What percentage of data falls between 18 and 22?
Approx. 34%
300
What's the mean?
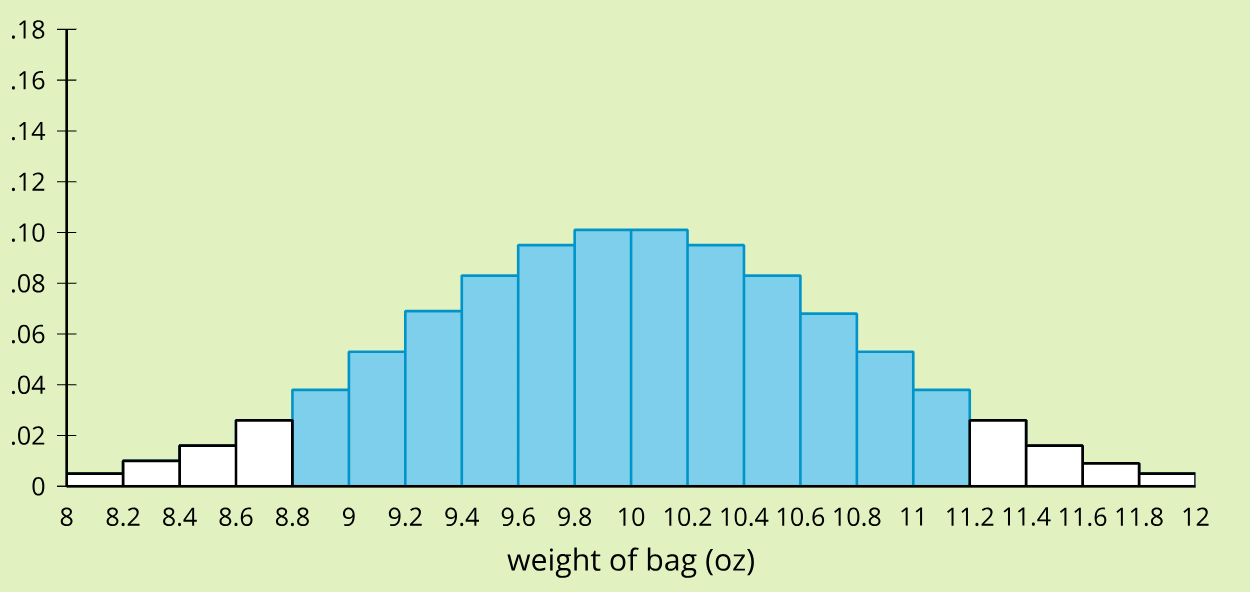
10
400
Tyler is interested in how different environments affect dandelion plants. For a science fair project, Tyler looks for dandelions growing in the grass and growing in dirt without grass. He counts the number of days it takes each dandelion to turn from a yellow flower into seeds. After 6 weeks, he compares the number of days it takes for the dandelions growing in the grass to turn from a yellow flower into seeds to the number of days it takes for the dandelions growing in the dirt without grass to turn from a yellow flower into seeds
Observational study
400
A specific distribution in statistics whose graph is symmetric and bell-shaped, has an area of 1 between the x-axis and the graph, and has the x-axis as a horizontal asymptote.
Normal Distribution
400
A distribution is approximately normal with a mean of 18 and a standard deviation of 4. What percentage of data is less than 10?
Approx. 2.5%
400
The proportion of data points between 88 and 89.
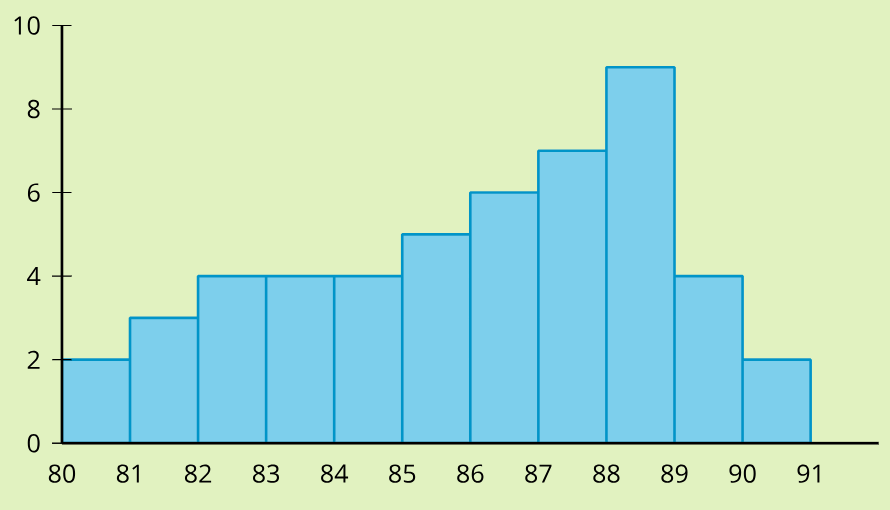
0.18
500
For physics class, Jada wants to know how the surface of different ramps affects the maximum speed of a marble being rolled down the ramp. To study this, she compares the maximum speed of a marble rolled down ramps with different surfaces. She rolls the same marble down each type of ramp 10 times. What type of study is this?
Experimental study
500
A study that collects data without influencing the subjects directly.
An Observational Study
500
A distribution is approximately normal with a mean of 18 and a standard deviation of 4. What percentage of data is greater than 22?
Approx. 16%
500
The proportion of data points which fall between 80 to 81
0.04