Vocabulary
Curves and Figures
True or False
Interpretation
Hey, it's R code!
100
One of two mutually exclusive hypotheses in a hypothesis test. States that a population parameter does not equal a specified value.
What is an alternative hypothesis?
100
If a normally distributed variable has a mean of 10 and a standard deviation of 1, there is about a 95% probability that an observation takes a value between what two numbers?
What is 8 and 12?
100
When comparing the mean and the median, it's the median that is most sensitive to statistical outliers.
What is FALSE?
100
The 95% confidence interval for the sample mean in my data is (25, 40). I interpret this information in the following way:
What is: we can be 95% confident that the population mean we are trying to approximate is in the interval (25,40)?
100
I have a dataframe called dat with a variable called freecoll. This variable has some missing data, which is coded as a 99. I remove the 99s from this variable in the following way ________.
What is the following?
dat$freecoll[dat$freecoll==99] <- NA
There are multiple right answers here! The internet is your friend!
200

This equation represents ______ ?
What is standard error?
200
The area shaded in red on the following figure: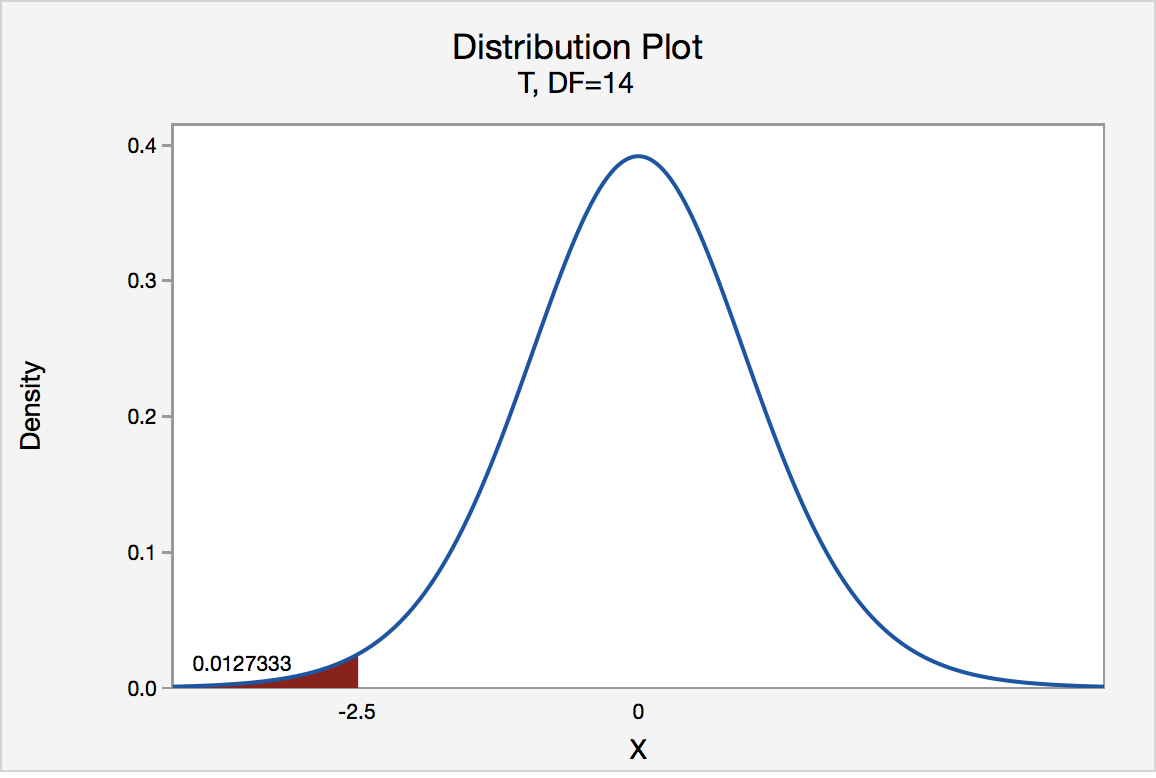
What is the p-value?
200
If an alpha value is 0.01, this means the estimated probability of committing a Type 1 error is 1%.
What is TRUE?
200
If a researcher were to switch from a 95% confidence level to a 99% confidence level, it would affect Type 1 and Type 2 errors in this way.
What is the probability of Type 1 errors would decrease and Type 2 errors would increase?
200
t.test(freecoll, youngold, data=dat)
______ describes the type of test this is and what the dependent and independent variables are.
What is a two-sample t-test between the variables freecoll and youngold, where freecoll is the dependent variable and youngold is the independent variable?
300
The ______ distribution, also called the z-distribution, is a special normal distribution where the mean is 0 and the standard deviation is 1.
What is the standard normal distribution?
300
Suppose a researcher studying attitudes on skinny jeans finds 40% of respondents hate them, 40% of respondents love them, and the remaining 20% are ambivalent. The distribution of these responses would be referred to as this:
What is bimodal?
300
I've found that going on a midday walk is 0.9 correlated with me purchasing a coffee I don't need. This both tells me that going on a midday walk is positively associated with purchasing a midday coffee, and that I am 90% more likely to purchase a coffee once I go on a walk!
What is FALSE?
Correlations can tell us how related two things are and the direction of that relationship (positive or negative). They do not give us the ability to predict outcomes --- you should look at regressions for that!
300
You run a regression where passing the exam is the dependent variable (1 = pass, 0 = not pass) and sleeping eight hours the night before the test is the independent variable (1 = slept eight hours, 0 = did not).
You find that the variable "sleeping eight hours" has a coefficient of 0.5 and a standard error of 0.01. You evaluate this result assuming a confidence level of 95% for significant results.
All the above information leads you to conclude _________.
What is: we can be 95% confident that sleeping eight hours has a positive effect (0.5 on a 0-1 scale) on a student's probability of passing the exam?
300

The correct way to interpret these results would be ____.
What is: we can reject our null hypothesis and can be 95% confident that the difference in means between the groups's support of free college (those <30 and those => 30) is not 0.
400
I run an experiment trying to figure out how Democrats feel about pancakes. To do this, I randomly poll Tufts undergraduates. When I submit the paper to a journal, a reviewer writes back that Tufts undergraduates are quite different from the broader American population. They are critiquing my experiment's _____?
What is external validity?
400
The plot you should use to display the coefficient results of a multivariate regression? This type of plot also lets you show uncertainty and compare estimates to a baseline!
What is a coefficient plot?

400
If the coefficient of correlation (R) between two variables is 0.6, 60% of the variation in the dependent variable can be explained by the independent variable.
What is FALSE? If R = 0.6, R^2 = 0.36, meaning 36% of the variation in the dependent variable can be explained by the independent variable.
400
Assume that the least-squares regression equation for hours partied based on final exam scores looks like the following:
y = 5 + 0.5x
The correct interpretation of the slope of this equation.
What is: for every extra point a student receives on their final, they will party 0.5 hours more?
400

The above produces this type of graph.
What is a difference of means graph with 95% confidence intervals?

500
______ is when two independent variables in your model are correlated with each other.
What is collinearity?
500
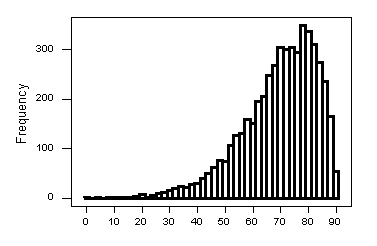
This plot is called ____ and it is skewed ____?
What is a histogram and left?
500
I can change my alpha value at any time during my data analysis and it's totally okay.
What is FALSE? That's p-hacking and will also probably bring a statistical curse upon your house. Please don't do this!
500
Assume being South Asian and a theater kid both cause a newfound obsession with season 2 of Bridgerton even though you didn't watch the first season, which we'll call obsession. Also, assume that both being South Asian and being a theater kid do not affect the dependent variable INDEPENDENTLY of each other.
This is what happens when you add being a theater kid to a model that predicts obsession with South Asian identity.
What is, the coefficient for the effect of being South Asian will change because you may have been accounting for being a theater kid without realizing it in the earlier version of your model!
Bonus: What would have happened if being South Asian and being a theater kid affected the dependent variable independently?
500
What is the name of the website you should turn to first if you have problems with R on the exam?
What is Stack Overflow!