Basic Vocab
Empirical Rule
Visual Summaries
Numerical Summaries
Sampling
100
The process of collecting, describing, and organizing information from a sample.
What is Descriptive Statistics?
100
This kind of data distribution is required for using the Empirical Rule
What is Bell-Shaped? or Normal? or Symmetric?
100
The best way to represent relative frequency for qualitative data.
What is a Pie Chart?
100
Find the mode and range of the data:
2, 2, 6, 8, 8, 9
Modes are 2 and 8. The range is 7.
100
Using a random number generator to select the subjects for a sample
What is Simple Random Sample
200
Complete collection of objects or individuals that are being studied
What is Population
200
This amount of data is within 2 standard deviations of the mean.
What is 68%?
200
List two differences of a bar graph and a histogram.
quantitative/qualitative data and gaps between bars
200
Find the median and the mean of the data:
2, 2, 6, 8, 8, 9
The median is 7. The mean is 5.8
200
Sample is selected by taking the members of the population that are easiest to
reach
What is Convenience Sampling
300
A subset of a collection of objects being studied
What is Sample?
300
This percent of the data is below the mean.
What is 50%?
300
The width of the classes in this histogram is_____.

The width of the classes in this histogram is 10.
300
If we added a outlier, which measure of center would change the most?
2, 2, 6, 8, 8, 9, 50
The mean. It is not resistant.
300
Choosing every 10th student from the roster
What is Systematic?
400
Quantitative data that can take on any value (not just whole numbers)
What is Continuous Data?
400
95% of the data is within _____ standard deviations of ______.
95% of the data is within TWO standard deviations of MEAN.
400
What is the shape of the histogram? Explain your choice.

Skewed left; tail/outliers on the left
400
Find the standard deviation of the sample data:
2, 2, 6, 8, 8, 9
The standard deviation is 3.13
400
Selecting 10 schools at random from a city and surveying all the students in those selected schools
What is Cluster Sampling
500
Quantitative data that possess gaps.
What is Discrete Data?
500
If you cannot use the Empirical Rule on a set of data, you can use this instead.
What is Chebyshev's Inequality?
500
What type of graphical representation is this? Be specific.
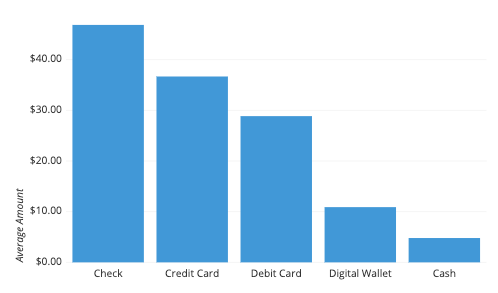
Bar graph: Pareto Chart
500
Find the variance of the sample data:
2, 2, 6, 8, 8, 9
The variance is 9.77
500
Dividing a population of college students based on their majors then randomly selecting a proportional number of students from each group.
What is Stratified?