Excel Basics
Functions and arithmetic
1 Quant Variable
Single Series Scatterplots
Multi Series Scatterplots + Random
100
All excel arithmetic and functions must begin with this symbol.
"="
100
What is the function that can be used to find the added total of a dataset from B2 to B25?
=sum(B2:B25)
100
What are the two types of graphs we have created for 1 quantitative variable?
Histogram and Boxplot.
100
How many quantitative variables are used for a single series scatterplot?
2, an x and a y
100
How many explanatory variables are needed for a Multi- series scatterplot?
Only 1, explanatory is x.
200
To create a chart in excel, select data and then click on the ______ tab in the tool bar.
Insert
200
What is the function that can be used to find the mean of a dataset from A2 to A15?
=average(A2:A15)
200
What is the chart title for a histogram showing test scores?
Distribution of Test Scores
200
If the correlation between study time and test score is 0.86, describe the relationship between the variables.
The correlation r=0.86 indicates a strong, positive linear relationship between study time and test scores.
200
RANDOM: Where is Ms. Cintron from (born + raised)?
PUERTO RICO!!!!!! <3
300
TO select data that is not next to each other, you can select while you push down on the _____ key.
CTRL
300
Which symbol represents multiplication in excel?
*
300
What is the chart title for a boxplot on number of shoes owned by students in a class?
5 Number Summary of Shoes Owned by Students
300
If the trendline equation for study time vs test score is Score = 6.13*(study time)+51.38, interpret the slope of the equation.
As study time increases by one hour, the test score is predicted to increase by approximately 6.13 points.
300
Before the data names are edited, what is names will be displayed in the legend of a multi-series scatterplot with only 2 response variables?
'Series 1' and 'Series 2'
400
Certain actions (like finding sum, min, max, average, etc.) can be done with excel ______.
Functions
400
Which symbols represents adding exponents in excel?
^
400
If Q3 in a dataset of tests scores is 86, interpret the value.
Options:
1) 86 is the 75th percentile in a distribution of test scores.
2) 75% of test score fall below 86.
3) 25% of test scores fall above 86.
etc.
400
If the trendline equation for study time vs test score is Score = 6.13*(study time)+51.38, determine and interpret the score if a student studied for 3.5 hours.
Score = 6.13*(3.5)+51.38 = 72.835.
For a student that studied for 3.5 hours, their predicted test score is 72.835%.
400
RANDOM: How many student total are taking data science at this school? (Closest number wins)
32
500
When a cell is used in arithmetic in excel, that is called _____ __________.
Cell referencing
500
Which function will find the standard deviation for a dataset from A2 to A12?
=stdev(A2:A12)
500
Based on the histogram and boxplot, describe the distribution in context.
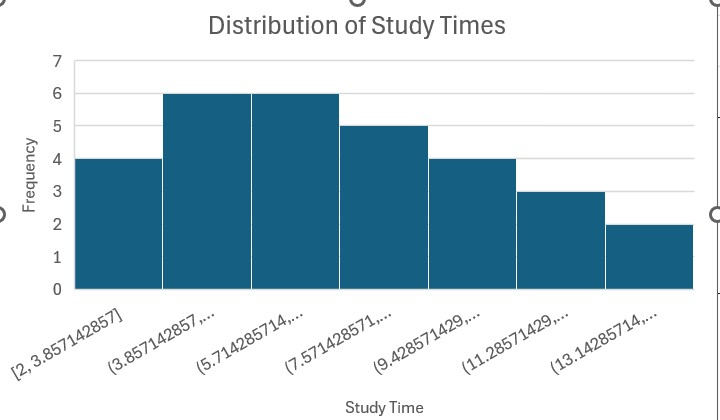
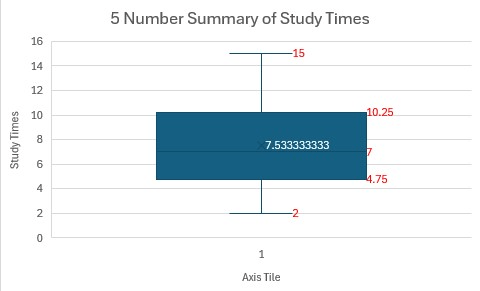
The shape of the distribution of study times is slightly skewed right, with a mean of 7.53 hours and a median of 7 hours. There are no apparent outliers. The range of study times spans from 2 to 15 hours, and the IQR spans from 4.75 to 10.25 hours.
500
If the trendline equation for study time vs test score is Score = 6.13*(study time)+51.38, determine and interpret the residual of a student who studied for 3.5 hours. Their actual score was a 78%.
Res = 78-72.835 = 5.165
For a student who studied for 3.5 hours, the LSRL underpredicted the score by 5.165 points.
500
A student wants to know how their math tests scores and their chemistry test scores correlate with the number of hours studied. He found that the correlation for hours studied vs. math scores is r_m=0.774 and the correlation for study time vs. chem score is
r_c=0.612 , compare the correlations.
Because the correlation of study time and math is stronger than study time and chem, we can conclude that math test scores are generally more consistent and predictable than chem scores.