Reading a Graph
Solve for 'x'
100
Which color had the MOST M&Ms?
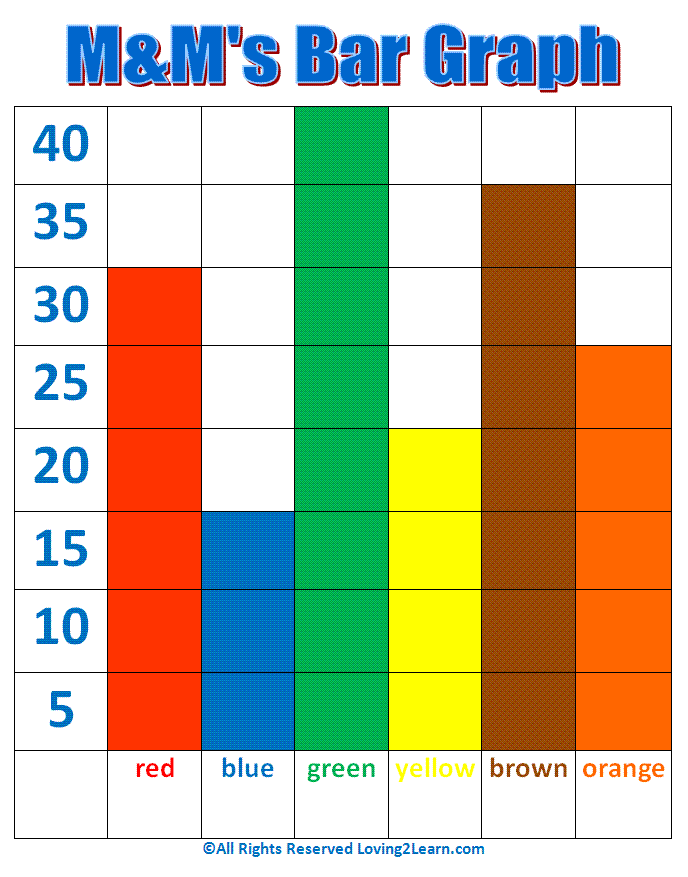
Green
100
x + 4 = 10
x = 6
200
How many people said 'Softball' (blue) was their favorite sport?

4
200
2x = 20
x=10
300
What is this type of graph called?![]()
Circle Graph
300
17 - x = 14
x = 3
400
What is the LARGEST percentage on this graph?
50%
400
25 + x = 31
6
500
TRUE or FALSE: You can show the same data in both a bar graph and a pie chart.
True
500
2x + 10 = 100
45