Visual Tools
Pops and samples
What's Normal?
Acronyms
Does it Measure Up?
100
It is used to show both central tendency and variation
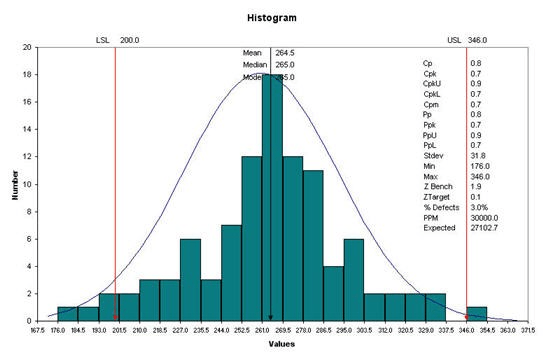
What is a histogram
100
Sample size rule of thumb for continuous data at the 95% confidence level
What is 30 or more data points
100
This rule used for normally distributed data says that 68% of the data points fall within +/- 1 standard deviation
What is the empirical rule
100
Population means use this acronym
What is mu
100
The acronym is MSA
What is Measurement System Analysis
200
Often used to compare multiple groups of data: different operators, geographic regions, product SKUs, machines, etc.
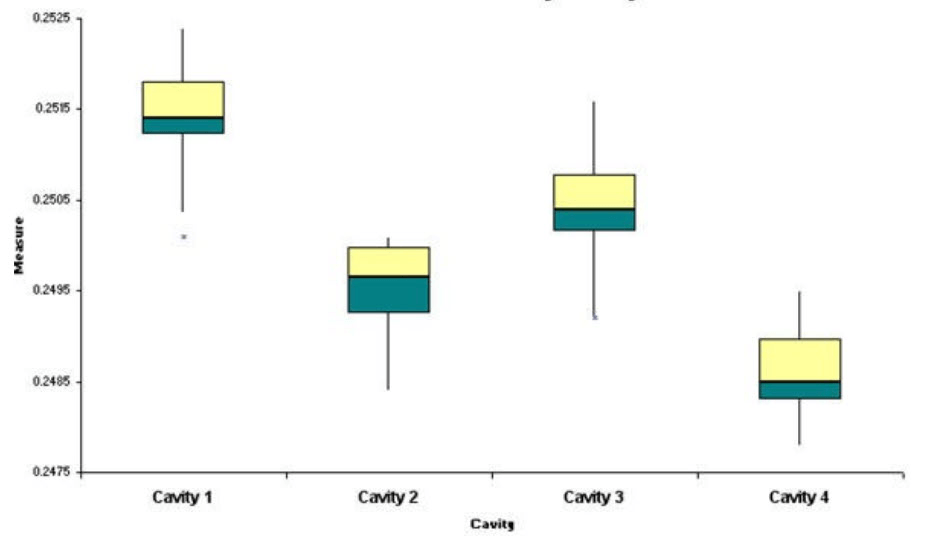
What is a box-whisker diagram
200
The type of data when mu and sigma are used to represent mean and standard deviation
What is population data
200
If we compare our point of inspection to the population mean and then divide by sigma we'll get this statistic
It's often used as the sigma level of performance for a process.
What is a Z score
200
Sample means use this acronym
What is Xbar
200
A common experiment to determine the amount of variation introduced by the equipment and appraiser; the formal method uses ANOVA, the simple method compares ranges and we'd like it to less than 30%
What is Gage R&R
300
A simple time series chart that helps show trends, shifts, or runs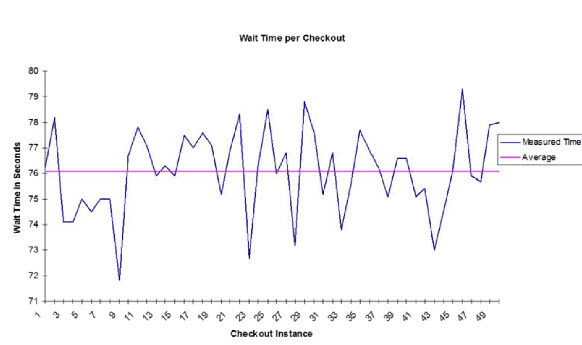
What is a run chart
or
What is a line chart
300
When doing a precise sample size calculation, we often want to know the amount of variation in the population. If we don't have the population standard deviation available, what can we use as an approximation?
What is sample standard deviation.
or
What is pop range divided by 6 or 5
300
An analyst will perform any of these activities to test for this:
- Visual inspection
- Mean, median, mode test
- Anderson Darling test (p-value greater than .05)
- Normal probability plot (R2 value greater than .9)
- Empirical rule test
What is testing for normality
300
A measure of process performance that compares the width of the process to the width of the specification limits AND how close it is to the nominal (center) target.
What is Cpk
300
Repeatability is about _________
Reproducibility is about __________
What is equipment or machine variability
and
human or measurer or appraiser variability
400
A time-series chart that helps an analyst determine whether the variation is special or common cause.
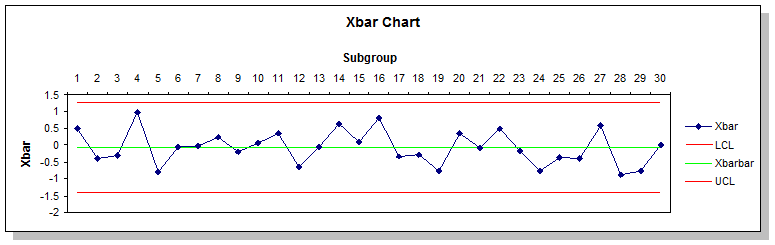
What is a control chart
400
When this calculated, it gives a range of values that the population mean could fall within at a certain level of confidence
e.g
pop mean= [low, high] value
What is a confidence interval
400
A technique that will convert a Z score into a percentage
What is any of these:
Z score table look up
=normdist function in Excel
QI Macros histogram with Cp/Cpk
400
Often confused with USL and LSL, they instead show the range of common process variation and are usually set to +/- 3 standard deviations
What are control limits
or
What is UCL and LCL (upper and lower control limits)
400
The amount of variation present in a Gage R&R study that allows the analyst to say it's a very good, robust measurement system
What is 10% or less
500
Used to help determine whether data is normal, this tool plots residuals data. We want to see the residuals randomly close to the 45-degree line. A R-squared value of .9 or higher is also good.
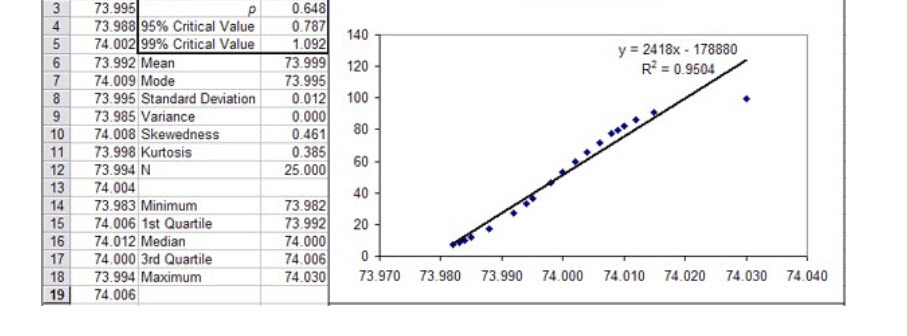
What is a normal probability plot
500
We calculate this when we're using a sample mean to represent a population mean. It involves taking the variation of the population and dividing by the sqrt(n)
What is standard error
500
When a physical constraint or limits are placed on min/max values, the distribution of our business data often becomes this type.
What is non-normal data
500
The control chart name when measuring individual items that are continuous
What is an ImR chart or an XmR chart
or
What is an Individuals and Moving Range Control Chart
500
A hypothesis test is run on two process datasets and in the output pane, you see a p-value that is less than .05. For almost all tests excluding Anderson Darling, what does this indicate?
What is rejecting the null hypothesis
or
What is "the data sets are different"