Displaying Data
Measures of Center
Variables
Analyzing Categorical Data
Describing Distribution
100
Name this graph.
What is a box plot?
100
The middle term of a series arranged in order of magnitude.
What is median?
100
The object described by a set of data.
What is an individual?
100
This graph distribution has two modes.
What is bimodal?
200
Name this Graph
What is a histogram?
200
The area of variation between upper and lower limits.
What is range?
200
A variable that contains numbers/can be averaged
What is a quantitative variable?
200
This graph has a tail going to the right.
What is right skewed?
300
Name this graph
What is a dot plot?
300
The value that occurs most frequently in a given set of data.
What is mode?
300
A variable that assigns an individual to a group.
What is a categorical variable?
300
The left and right sides of this graph appear mirrored.
What is symmetric?
400
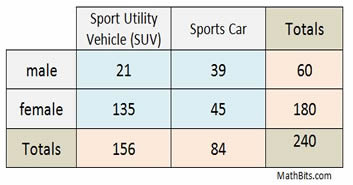
Identify this chart.
What is a two way table?
400
The average of all values.
What is mean?
400
Identify the variables within this chart.
What is 2 categorical variables and 4 quantitative variables?
400
In this distribution the mean is greater than the median.
What is right skewed?
500
These values are displayed in a box plot. (name 6)
What are minimum, maximum, Q1, median, Q3, IQR, and range?
500
Q3 - Q1
What is Interquartile Range?
500
Identify the variables within this chart.
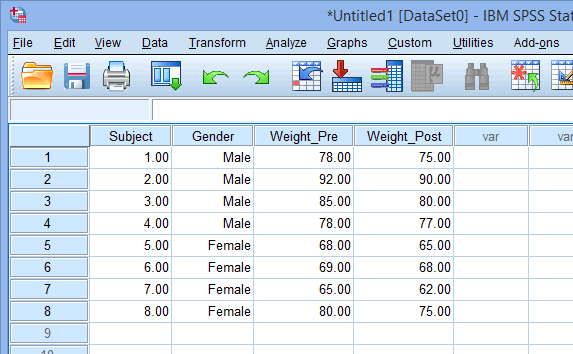
What is one categorical variable and two quantitative variables?
500
In this distribution, the mean is less than the median.
What is skewed left?