Interpreting Data
Adding and Subtracting with a Line Plot
Review
100

What day had the most cars sold?
Friday
100
How many student towers measured 8, 9, and 10 inches?

4 + 1 + 2 = 7
100
987-492=?
495
200
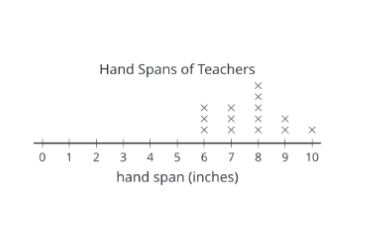
How many teachers have a hand span of 7 inches?
3 teachers
200
How many more students had 12 inch towers than 20 inch towers?
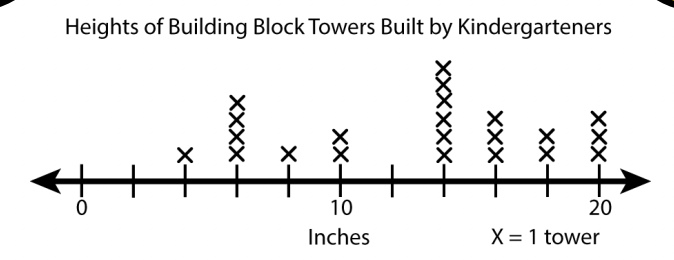
6 students had 12 inch towers.
3 students had 20 inch towers.
6-3= 3
3 more students had 12 inch towers than 20 inch towers.
200
What is the value of the 5 in 753?
50
300
Look at the following line plot. How many group members had pencils measuring 13 and 14 centimeters?
2 measured 13cm.
2 measured 14cm.
So, 2+2= 4 members
300
How many classrooms were at 50 or less?

15
300
Does this happen in the AM or PM? Taking the bus home after school.
PM
400
Look at the following line plot. How many students saw less than 10 butterflies?

10 students
400
How many carpets are in this survey?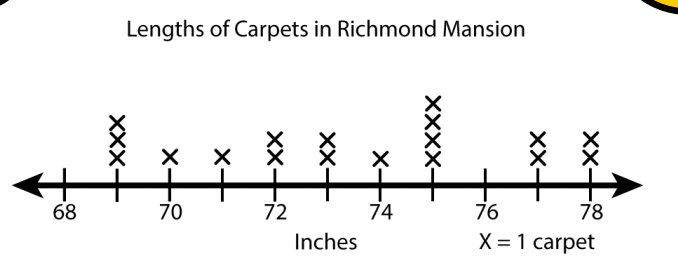
18
400
Finish the skip counting... 75, 80, 85, 90, ___, ____, ____, ____
95, 100, 105, 110
500
Look at the following line plot. How many more six year olds are in afterschool care than ten year olds?
4 more
500

What is the most candy bars students had?
8 candy bars
500
652-413=?
239