Solving Equations
Solving Inequalities
Graphing Inequalities
Linear Functions 1
Linear Functions 2
100
-20 = x - 5
x = -15
100
x - 5 > -7
x > -2
100
Graph x < 13 on a number line.
←○
-----12-----13-----14-----
100
________ is the rise/run.
Slope
100
___________ is they-value when x=0
y-intercept
200
-10 - 7n = -3
n = -1
200
3x + 4 < 19
x < 5
200
Graph x > -2 on a number line.
○→
-----(-3)-----(-2)-----(-1)-----
200
In the equation y = mx +b, the variable ___ represents the slope.
m
200
In the equation y = mx +b, the variable ___ represents the y-intercept.
b
300
x/3 - 7 = -4
x = 9
300
7 ≤ 2x - 5
6 ≤ x or x ≥ 6
300
Graph x ≤ 2 on a number line.
←•
<-----1-----2-----3----->
300
Identify the slope
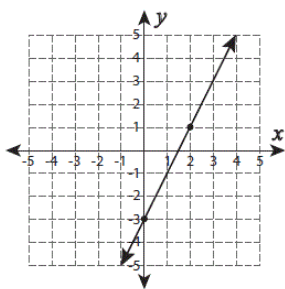
2
300
Identify the y-intercept
-3
400
-6(4x + 7) = 30
x = -3
400
-x+2 ≤ -8
x ≥ 10
400
Graph x ≥ -9 on a number line
•→
<-----(-10)-----(-9)-----(-8)----->
400
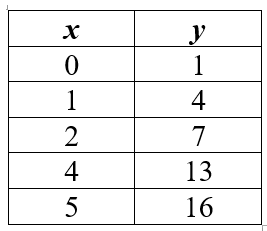
Identify the slope.
4
400
Identify the y-intercept.
6
500
6 - 3b = -6b - 12
b = -6
500
-3(2-x) ≥ 6(x +1)
x ≤ -4
500
Graph x > -2 AND x < 2 on a number line
○→ ←○
<---(-2)---(-1)---0---1---2--->
○---------------------○
<---(-2)---(-1)---0---1---2--->
500
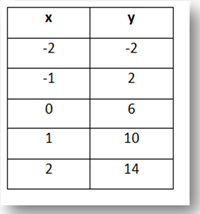
Given the table, write the equation of the line in y=mx+b form.
y = 3x + 1
500
Write the equation of the line in y=mx+b form.
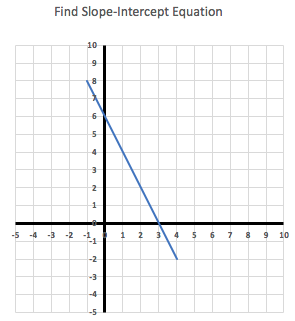
y = -2x + 6