Functions
Graph Analysis
Linear vs Nonlinear
Modeling Relationships
Miscellaneous
100
Q: What does a function assign to each x-value?
A: One y-value.
100
Q: What do you analyze to describe the functional relationship between two quantities from a graph?
A: Whether the function is increasing or decreasing.
100
Q: Provide an example of a linear function.
A: y = 2x + 1.
100
Q: How can you model a linear relationship given a table of values?
A: Find a constant rate of change between values.
100
Q: A bakery sells cupcakes for $2 each. The bakery also has a fixed cost of $30 for baking supplies. Write an equation to represent the total revenue, y, the bakery makes from selling x cupcakes.
The equation that represents the total revenue, y, the bakery makes from selling x cupcakes is: y = 2x + 30
200
Q: Define the graph of a function.
A: The set of ordered pairs (x,y).
200
Q: How can you determine if a function is linear from its graph?
A: A linear function forms a straight line on a graph.
200
Q: How are linear and nonlinear functions different when represented in tables of values?
A: Linear functions show a constant rate of change in tables.
200
Q: What does the slope represent in a linear relationship?
A: The change in y for every unit change in x.
200
Sarah is saving money for a new bike. She currently has $50 saved and is saving $5 per week from her allowance. Write an equation to represent the total amount, y, Sarah will have saved after saving for x weeks.
A: The equation that represents the total revenue, y, the bakery makes from selling x cupcakes is: y = 2x + 30
300
Q: Describe qualitatively a graph where the function is increasing.
A: The graph rises from left to right.
300
Q: Give an example of a feature that a nonlinear function can exhibit on a graph.
A: Curves or bends.
300
Q: What does m represent in the equation y = mx + b?
A: Slope.
300
Q: Explain how to recognize a linear function from its equation.
A: If it is in the form y = mx + b.
300
Q: Given the equation in point-slope form: y - 3 = 2(x - 4), translate this equation into slope-intercept form.
A: The equation in slope-intercept form is: y = 2x - 5
400
Q: Explain what it means for a function to have a minimum value on a graph.
A: It is the lowest point on the graph.
400
Q: Is the following graph a function?
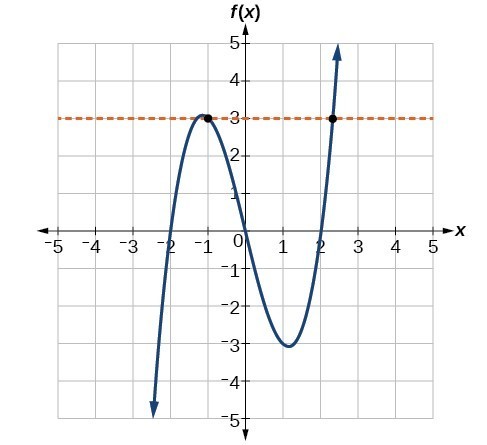
A: Yes
400
Q: Explain the meaning of the y-intercept in the context of a linear function.
A: It is the point where the graph intersects the y-axis.
400
Q: How can you construct a function to model a linear relationship from a verbal description?
A: Identify the rate of change and y-intercept
400
Q: Graph -3/4x + 5 = y
A: Teacher Check
500
Q: How can you describe a nonlinear function from its graph?
A: A nonlinear function does not form a straight line on a graph.
500
Q: Describe how you can tell if a function is nonlinear from its graph.
A: A nonlinear function does not have a straight-line graph.
500
Q: Describe how linear and nonlinear functions differ in verbal descriptions.
A: Linear functions have a constant rate of change in verbal descriptions.
500
Q: Tommy is mowing lawns in his neighborhood to earn money. He charges $20 for the initial lawn mowing service and then $10 for each additional lawn he mows. Write an equation to represent the total amount Tommy earns, y, after mowing x lawns.
A: The equation that represents the total amount Tommy earns, y, after mowing x lawns is: y = 10x + 20
500
Q: Sarah is creating a savings plan to buy a new laptop. She starts with $100 saved and plans to save $20 per week from her allowance. Write an equation in slope-intercept form to represent the amount of money, y, Sarah will have saved after x weeks. Then, graph this equation to show her savings over time
The amount of money Sarah will have saved after x weeks can be represented by the equation: y = 20x + 100