Types of Association
Trend Lines
R Squared, Interpolation, and extrapolation
Using Linear Regressions
What Does It Mean?
100
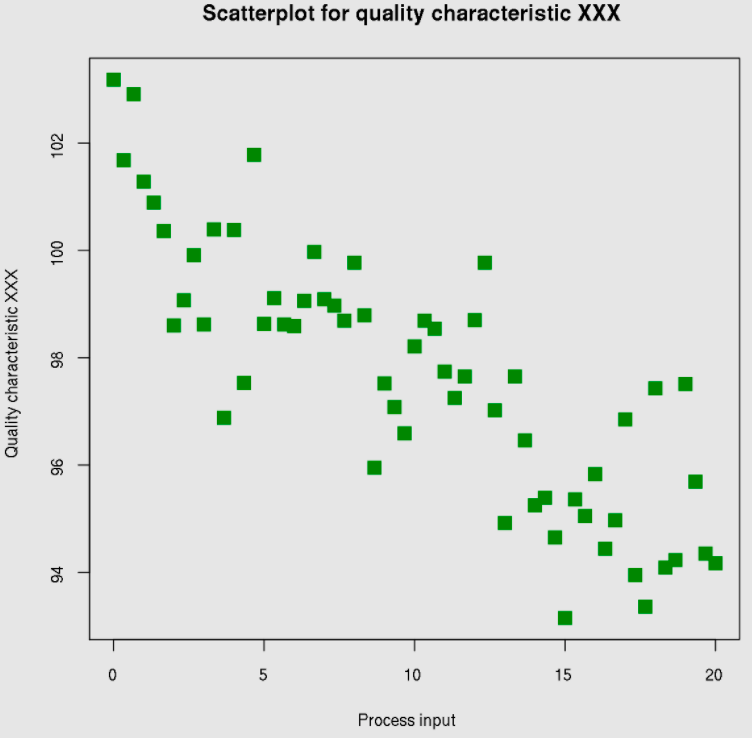
Positive, negative, or no association?

positive
100
Why is this a bad trend line?

it doesn't follow the trend
100
Two variables have a correlation of -0.89. What is R-squared?
0.7921
100
An analysis of Age (in years) versus Total Weekly Purchases (dollars) generates the linear model of Predicted Purchases = 539.803 + 1.103Age. Is the y-intercept meaningful?
No, a zero-year-old person cannot make purchases.
100
What kind of data is the arrow pointing to, and what does it mean?

it is an outlier, does not follow the other data
200
Strong or weak?
weak
200
Which trend line is best?
C
200
Graph A has an R-squared of 0.38. Graph B has an R-squared of 0.52. The x variable has a greater impact on the variation of variable y in graph A. True or false. Explain.
False, R-squared measures the variation in the y due to x. R-squared is higher in graph B.
200
Given the linear equation:
Predicted Sales = 5,424 + 391*Number of Sales People Working
If 3 people are working, what would you expect the sales to be?
$6,597.00
200
A linear regression equation has an r-value of 0.04. What does this mean?
There is no correlation.
300
Linear, nonlinear, or no association?
nonlinear
300
As the age of the car increases, its value decreases. Which scatterplot represents this relationship?

C
300
The correlation between a cereal's fiber and potassium is r=0.903. What percent of the variability in potassium is accounted for by the fiber?
0.8154
300
A person tells you their Math SAT score was 500.
Predict their Verbal score using the linear model of Predicted Verbal SAT Score = 171.333 + 0.6943*Math SAT Score.
518.483
300
What does the point (88, 450) mean on this scatter plot?

When the temperature was 88 degrees, there were 450 beach visitors.
400
How are the associations in these scatter plots DIFFERENT?

one is strong and one is weak
400
Indicate what association you expect for the pair of variables: positive, negative, or none:
weekly sales of hot chocolate at a Montana diner; the number of auto accidents that week in that town
None. Remember even if something exists, it might be a spurious correlation.
400
The amount of the water bill for various amounts of water used can be modeled by the equation y = 1.75x + 12. Predict the amount of water one can use for a $26 water bill.
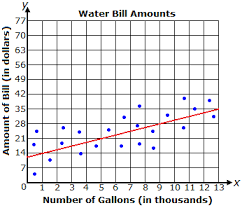
8,000 gallons
400
You have a y-intercept of 387 for the linear regression:
Predicted Calorie Intake from Food = 387 + 45.8*Number of Meals Eaten per Day.
This y-intercept has meaning. True or false.
False, when you eat zero meals, you consume 0 calories.
400
Describe the association in terms of the variables: "As cholesterol consumption..."

As cholesterol consumption increases, life expectancy decreases.
500
THREE answers required:
Positive or negative? Linear or nonlinear? Strong or weak?

Negative, linear, strong
500
The first rule of data analysis strongly applies to the best way to start observing the relationship between two quantitative variables.
Make a picture! A scatterplot can reveal a lot about the relationship between two variables, including whether the relationship is linear and whether there are any outliers.
500
The percent of respondents who listen to online radio since 2007 can be modeled by the equation y = 4x + 18. Predict the year that listenership will reach 70%.
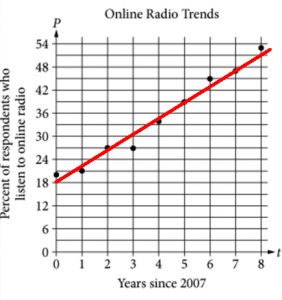
2020
500
The regression model of:
Predicted MPG = 46.87 - 0.084 Horsepower relates cars' horsepower to their fuel economy (in MPG).
Explain what the slope of 0.084 means.
For every increase in horsepower by 1, the fuel economy is predicted to go down 0.084 MPG.
500
The linear regression equation for the scatter plot is y = 635x + 20,000. What does the slope and the y-intercept represent in terms of the variables?

The population increases 635 people per year. The population was 20,000 in 1900.