Data Distributions
Boxplots
True/False
100
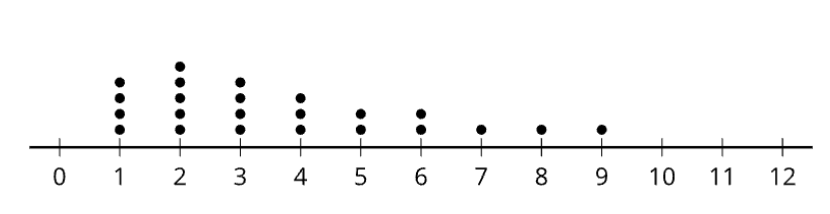
Would you use the mean or the median for this distribution?
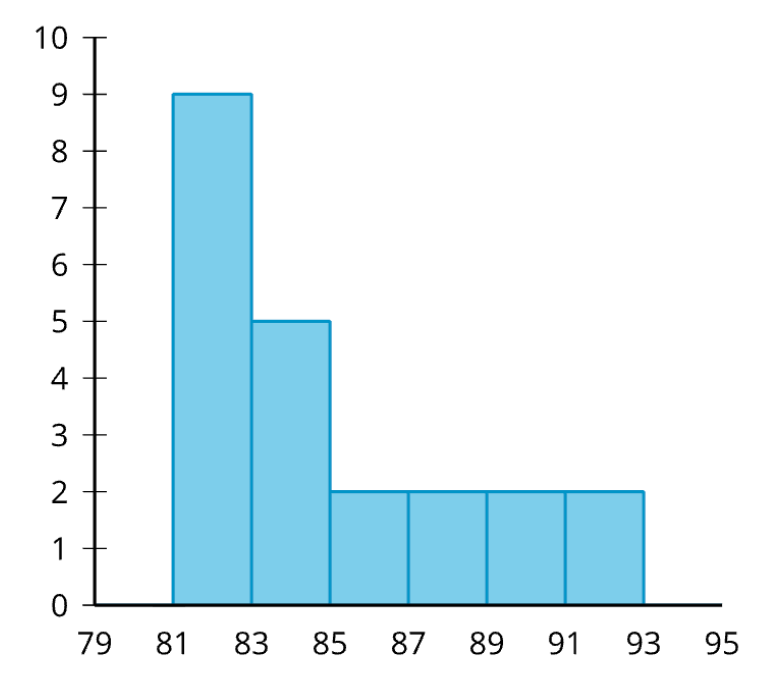
Median because it is skewed.
100
Find min, Q1, median, Q3, and max for this dataset: 12, 3, 6, 8, 1, 8, 8
1, 3, 6, 8, 8, 8, 12
Min: 1
Q1: 3
Median: 8
Q3: 8
Max: 12
100
The MAD of this data is zero because it is symmetric:
False.
200
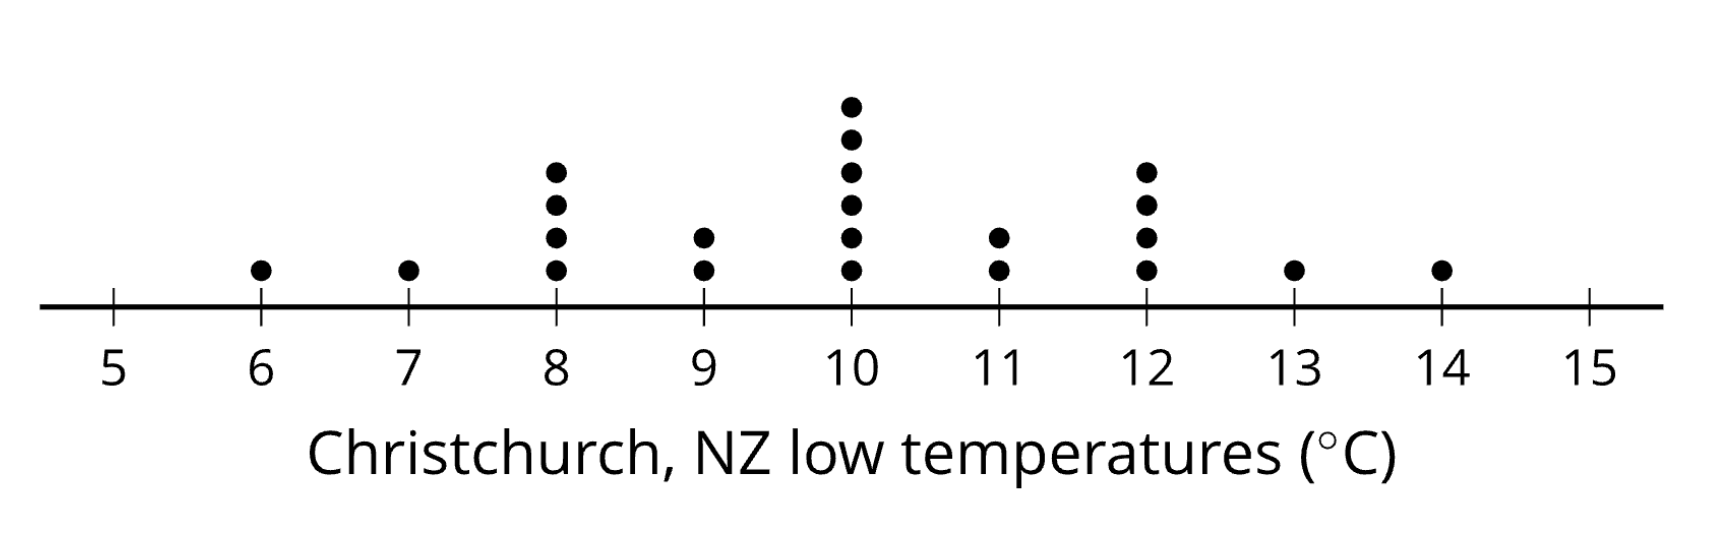
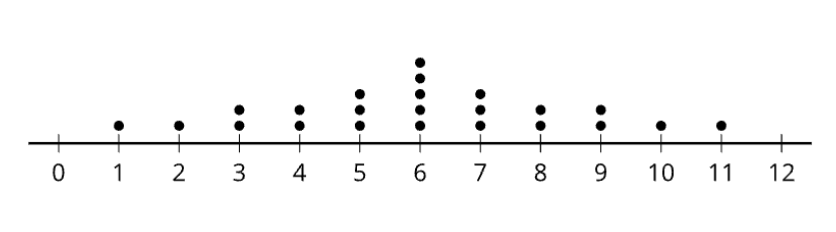
Would you use the mean or the median for this distribution?
Would you use the MAD or the IQR for measuring the variability?
Mean and MAD because it is symmetrical.
200
Find the min, Q1, median, Q3, and max of this dataset:
1,2,4,4,4,8,8,8,8,9
Min: 1
Q1: 4
Median: 6
Q3: 8
Max: 9
200
These dot plots have the same variability:
True
300
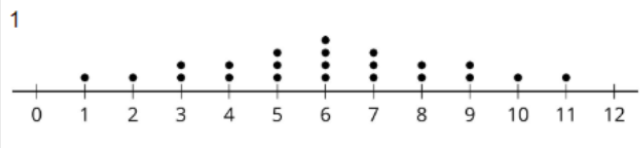
Which would be greater: the mean or the median?
The mean would be greater because it is being pulled up by the data values on the right.
300
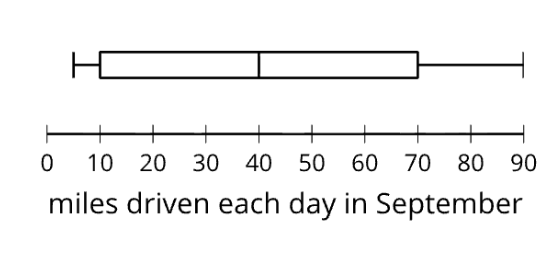
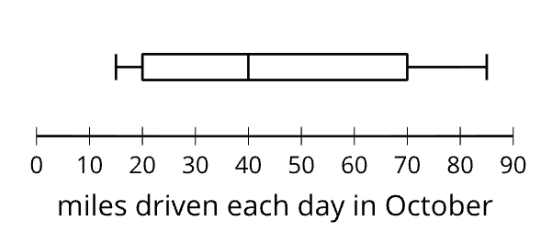
Make a boxplot for the data. Label all your marks with their value (Median ____ )
3, 9, 12, 12, 13, 15, 15, 17
min: 3
Q1: 10.5
Median: 12.5
Q3: 15
Max: 17
300
The median would be less than the mean.
False.
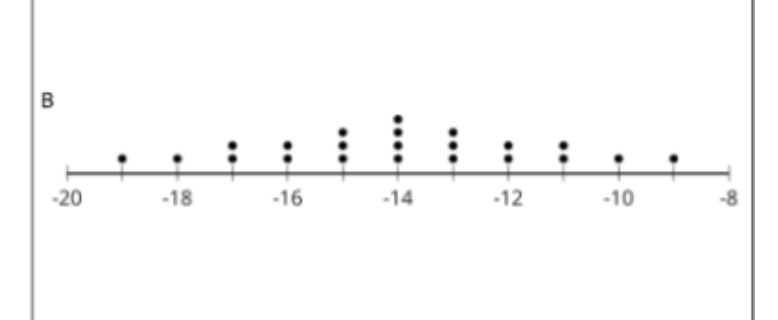
400
Which one has greater variability?
A:
B:
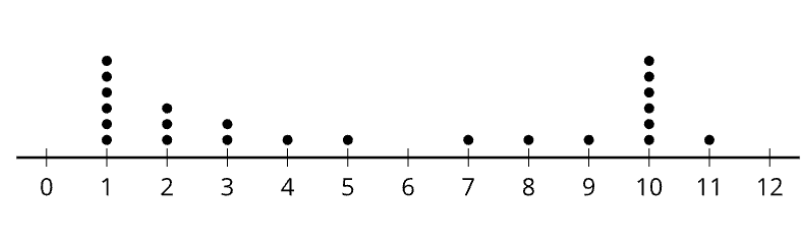
B, because data is further from the mean.
400
The median is equal to the mean for this dot plot.
True.
500
Which has a higher IQR?
A:
B:
A.
500
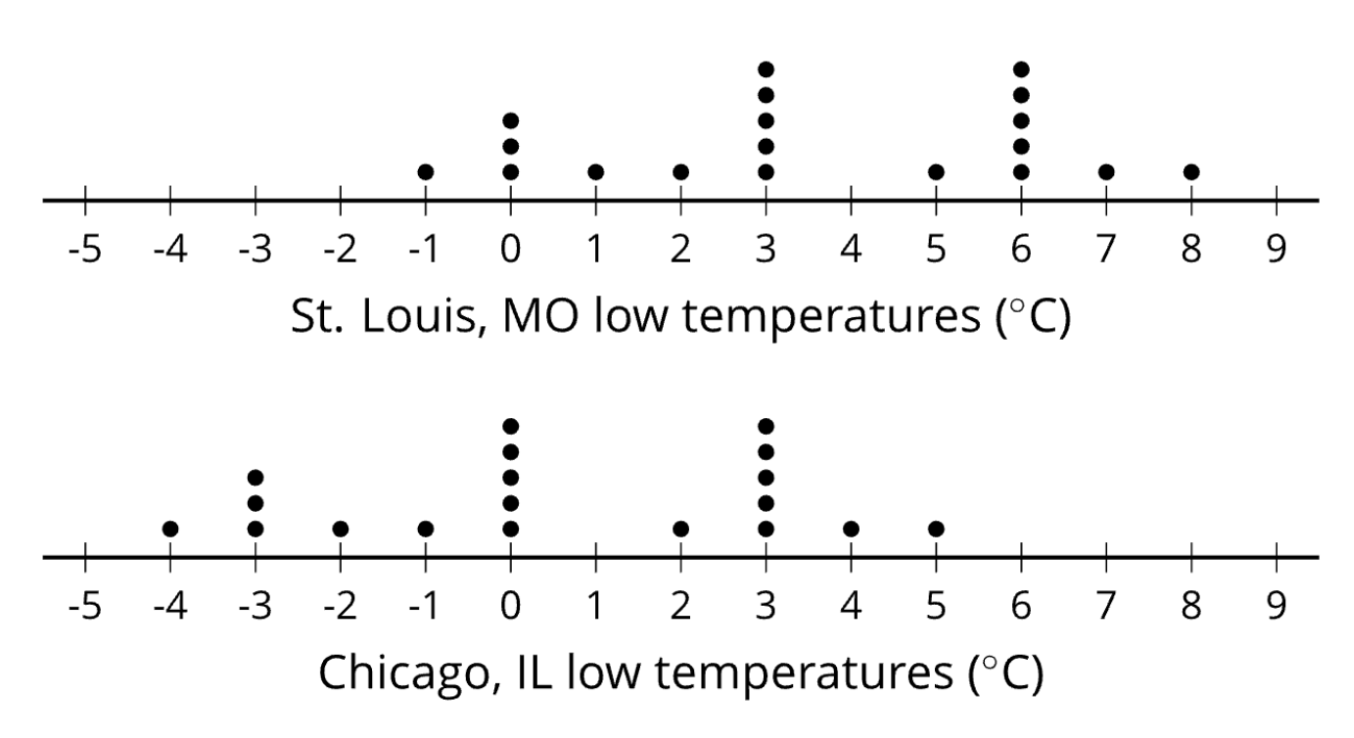
Noah's mean is higher than Jada's mean.
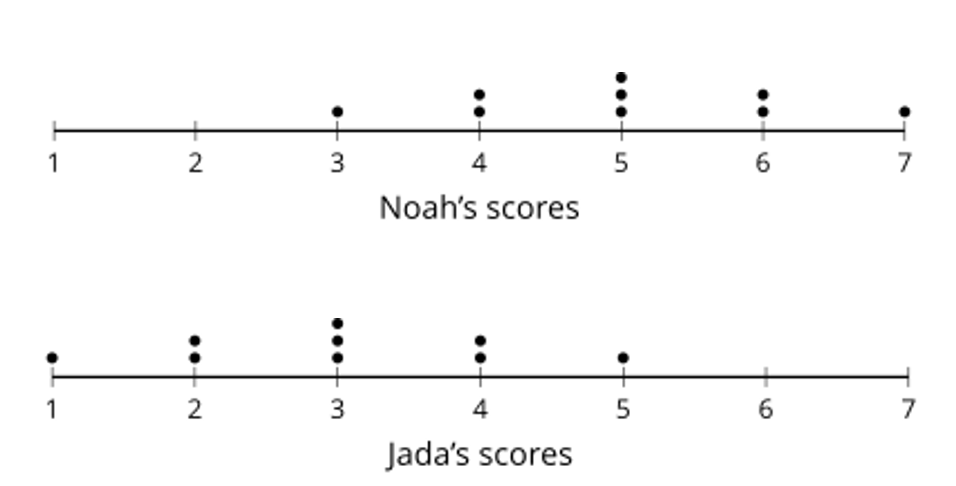
True.