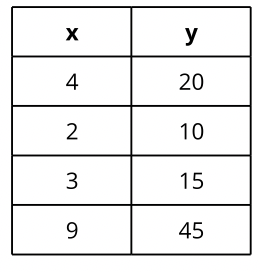
What two things does a graph need to have to be proportional?
- Goes through the origin (0,0)
- Straight line (steady/constant rate)
Based on the graph, what do x and y represent in this problem?
x = time (hours)
y = distance (miles traveled)
Write a word problem to match the table. Then write an equation to represent your word problem.

Word Problem:
Equation: y = 5x
Is this graph proportional? Why or why not?
Yes because it goes through the origin and is a straight line (increases at a steady/constant rate)
Based on the graph, how many miles are walked in 1 hour?
2 miles
The equation y = 0.5x can be used to determine the cost (y) in dollars per cookie.
What does the number 0.5 represent in this equation?
The cost ($) per cookie.
Is this graph proportional? Why or why not?

No because it does not go through the origin
The graph below shows the proportional relationship between gallons of gas and distance traveled. According to the graph, what is the unit rate of miles per gallon?

1 gallon = 35 miles
Based on the graph, what equation could be used to show the cups of peaches needed for every cup of grape juice?
y = 2/5 x
y = 0.4x
Does this table show a proportional relationship between number of mules and bales of hay? Why or why not?

Yes because the number of mules per bale of hay stays the same (0.5 mules = 1 bale of hay)
Based on the graph, what is the unit rate of gallons per dollar?

0.4 gallons per dollar
The table below shows the proportional relationship between number of cases and rolls of paper towels.
Write an equation representing the number of rolls (r) for every case (c) they order.
r = 12x
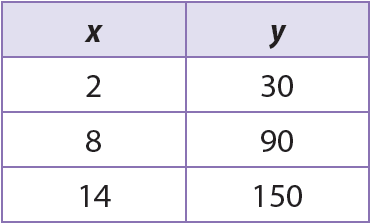
Does this table show a proportional relationship?

No because the constant of proportionality/rate does not stay the same.
2 to 30 = 15
8 to 90 = 11.25
14 to 150 = 10.71 (rounded)
The graph below shows the speed of 3 different students walking to class. All the students walked at a constant rate. Which student (A, B, or C) was walking the quickest? Explain your answer.

Student A was walking the quickest because they walked at a speed of 3m per second. Student B walked at a rate of 1m per second. Student C walked at a rate of 0.5m per second.
The table below shows the proportional relationship between number of children attending a party and number of liters of soda bought..
Part 1: Write an equation that represents the number of liters bought (L) for each child attending (c).
Part 2: If there are 12 liters bought, how many children are attending?
If there are 28 children attending, how many liters will be bought?

Part 1:
L = 3/4c or L = 0.75c
Part 2:
c = 16
L = 21

