Externality
Income inequality
Vocabulary
Goods
100
When there is a socially optimal output of level...
1. marginal social benefit be equal to marginal social cost
2. marginal private benefit exceed marginal private cost
3. marginal private benefit be less than marginal private cost
4. other options
Number 1
100
How do you measure social inequality?(2 examples)
Answer:
- Use Lorenz Curve
- Use Gini Coefficient
100
True or False:
When externalities are present, the market is able to produce the socially optimal amount of good
False
100
What is an example of a public good?
1. ice cream packet
2. national defense services
3. a loaf of bread
4. a home computer
Number 2
200
When there is a positive externality, marginal social cost will ...
1. be equal to marginal private cost
2. exceed marginal private cost
3. be less than marginal private cost
4. there's no relationship between Marginal social cost and positive externality
Number 1
200
What are possible ways to solve income inequality? (write at least 2)
Possible answer:
1. Progressive tax
2. Increase income wage
3. Improve the quality of education
200
Subsidy vs Tax
Subsidy: government funding on positive externalities
Tax: Pay extra amount to the government on negative externalities
200
Which of the following is not a characteristic of public goods
1. Government cannot fully exclude consumers who do not pay for the public goods
2. consumption by a person may reduce the chance of other consumers from purchasing the good
3. Most of the public goods are provided by government
4. None of the above
Number 2
300
Positive Externality vs Negative Externality
(Explain the differences with detail)
Positive externality happens when MSC is equal to MPC. Goods with positive externalities are underproduced to meet social efficient allocation (MSB = MSC). The government provides subsidy to firms to produce more and decrease deadweight loss.
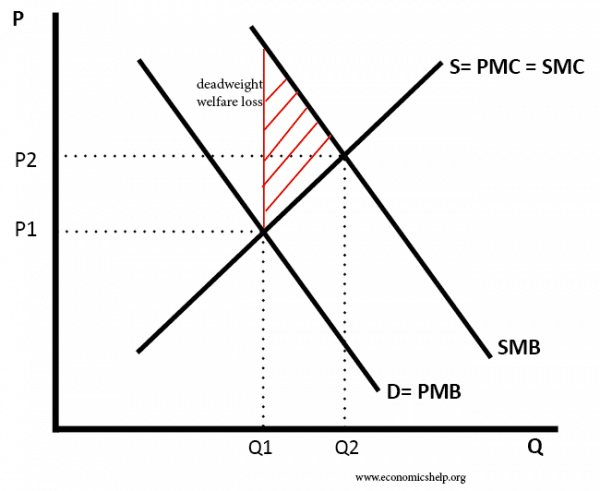
Negative externality happens when MSC is higher than MPC. Goods with negative externalities are overproduced to meet social efficient allocation (MSB = MSC). The government charges extra tax on externality to decrease deadwieght loss.
300
 Based on this graph, write the formula of the gini coefficient:
A/(A+B)
gini coefficient: the ratio of area A in between the line of equality and the Lorenz curve, to area B, below the line of equality
300
Progressive tax vs Regressive tax vs Proportional tax
Write definition for each term, and how they affect social/income inequality
Progressive tax: As the income increases, the amount of money a person has to pay as tax increases. The poor can pay relatively little tax. This reduces income inequality
Regressive tax: As the income increases, a person can pay less percentage of income as tax. The poor have to pay a higher percentage of income as tax than the rich. This creates more income inequality.
Proportional tax: No matter the rich or the poor, people have to pay the equivalent amount of money
300
Explain the difference between common resources and public goods by comparing their excludability and rivalry in consumption.
Example of public goods: narional defense, lights on streets and so on.
Non- excludable: goods that everyone have access to it.
non-rival: doesn't affect the other person access to a good
common resources are fish in the seas, natural resources
Non- excludable: goods that everyone have access to it.
rival: affect the other person access to a good
400
Graph a Negative Externality graph and show the effect of tax on the graph.

400
What does A represent in this curve?(Tip: B represents actual income distribution)
A represents inequality gap
400
What is Lorenz curve? Draw a graph with labeling.
The Lorenz curve shows the percentage of all income received by the poorest members of the population, from the poorest 0% to the poorest 100%. If everyone received the same income, the Lorenz curve would follow the line of equality. Income inequality causes the Lorenz curve to fall below the line of equality.
400
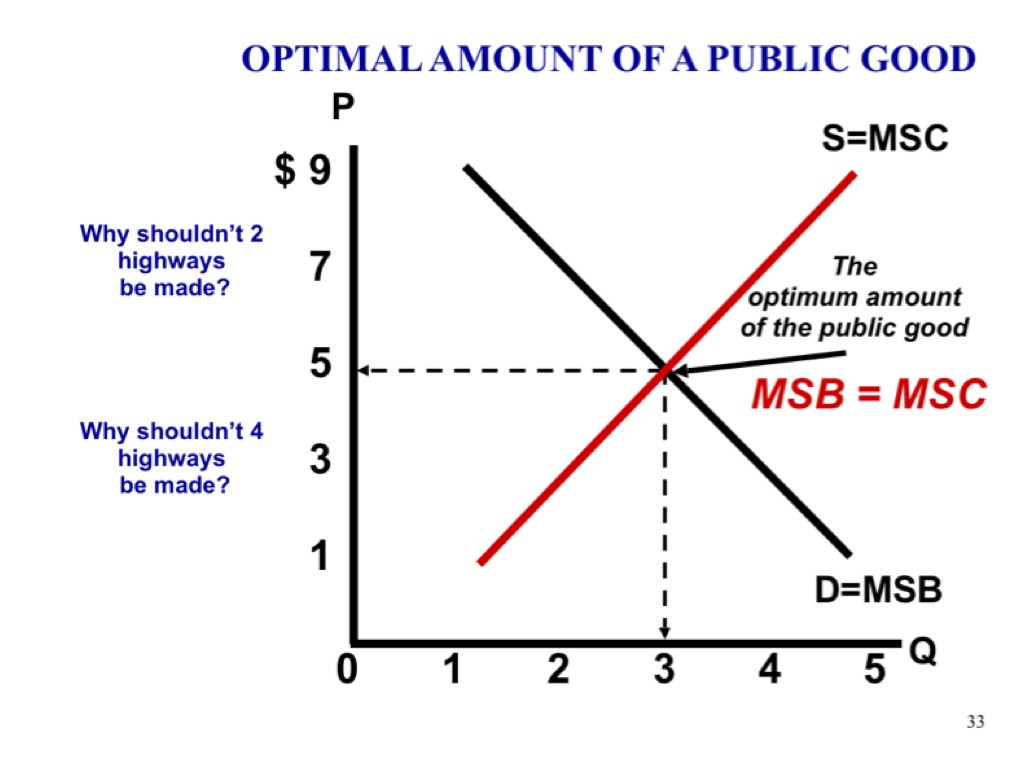
The efficient quantity of a public good is the quantity where
1) Average cost = price
2) average benefit = average cost
3) marginal social benefit = marginal social cost
4)non of the above
3
500
Graph a Positive externality graph and explain the effect of subsidy on the graph.
500
If there is total equality of income in society, then the gini coefficient would be
1) 0.5
2) 1
3) 0
4) 0.99
3
500
What is the definition of artificially scarce goods?
1. both nonexcludable and nonrival in consumption. Some public goods are paid by taxes
2. both excludable and rival in consumption
3. nonexcludable but rival in consumption, like clean water in a river
4. excludable but nonrival in consumption, like pay-per-view movies on cable TV
Number 4!
500
Draw a graph that illustrate the optimal amount of public good. And give reasons why overproduction is not beneficial to society