Name that graph
Box plot vocab
Factoring Quadratics
Mean Median or Mode
100
What is this line called?
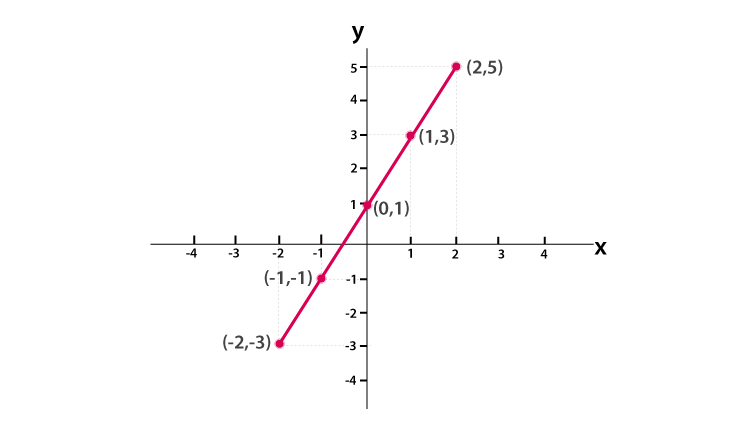
Linear
100
What does the middle value represent?

Median
100
y=x2+6x+8
(-4,0)
(-2,0)
100
Steph Curry total points over the last 10 games:
(33; 20; 28; 40; 18; 23; 10; 21; 37; 33)
Find the mean for this problem.
mean=26.3
200
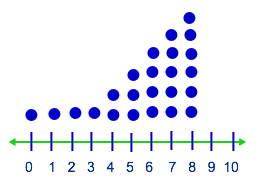
What type of graph is this?
Exponential
200
What is the formula to solve for "Range"?
Max-Min
200
y=x2+15x+50
(-5,0)
(-10,0)
200
Given the numbers listed: (no desmos calculator)
22, 15, 17, 8, 20, 8, 11, 11, 23, 32, 47, 32, 46
What is the median of this problem?
20
300
What is this called ?

Normal distribution
300
In order to solve for this term, you must add all the numbers and divide by the total number of values listed.
Mean
300
X2-8x+16
(4,0)2
300
Steph Curry total points over the last 10 games:
(33; 20; 28; 40; 18; 23; 10; 21; 37; 33)
What is the mode for this question?
40-10=30
400
What does this graph represent?
Left skewed
400
What does the lower extreme mean?
smallest value
400
y=-2x2-8x
(-4,0)
(0,0)
400
Find the Mean AND Median for the following:
11, 22, 43, 21, 5, 45, 31, 66, 11, 11, 21, 23, 25
*must get both correct for points
mean-25.76
median-22
500
What type of a graph is this called?
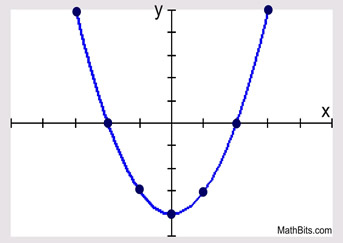
Quadratic
500
Also known as Q3
Upper quartile
500
x2-10x+49=4x+1
(8,0) (6,0)
500
Find the mean, median and mode for this problem:
4, 18, 19, 2, 43, 44, 44, 17, 16, 22, 43, 54, 65, 71, 10, 10, 21, 32, 2
mean-28.26
median- 21
mode- 44, 10