Vocab
Calculations
Graphing
Conceptual
100
Adding all the values together then dividing by the number of values.
What is mean/average
100
Find the mean of 
what is 18
100
Which data set has more spread

V
100
What is data
Data is collected facts, numbers, or information for analysis.
200
A value that is significantly farther away than expected
What is an outlier.
200
What is the median of 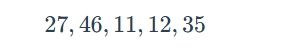
27
200
How many students were surveyed.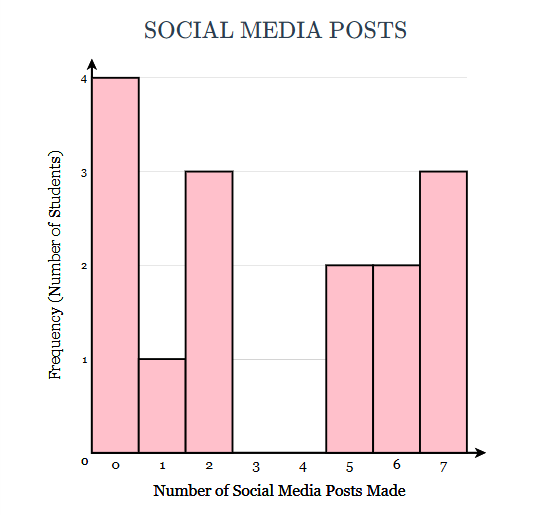
what is 15
200
What are statistics.
A numerical value calculated from data.
300
The 5 numbers in a box blot summary
Median, Q1, Q3, Min, Max
300
Give me the line of Best Fit for this graph rounded to the nearest tenth
y=28.7x+112.7
300
What is the range
10
300
What happens the standard deviation of a data set if I add an outlier and why?
Increases
400
Correlation
The relationship that two variables have with one another.
400
Find the standard deviation of this sample, rounded to the nearest thousandth.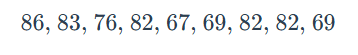
7.2456
400
What is the value of the upper quartile

55
400
Using your jeopardy group, give me an example of range.
Answers will vary.
500
Standard Deviation
The measure of the spread of the data.
500
Estimate the homework grade of a student with a 69 test grade using the data below.

75
500
What is the IQR of both data sets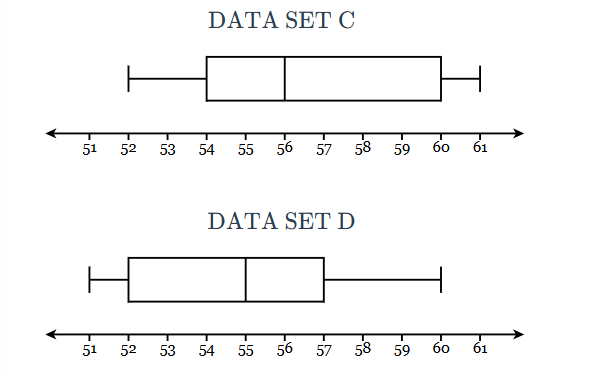
C=6 D=5
500
Give me an example of variables that would have a r=-.95
Answers will vary