Problem Solving
Data Representation
Finances
Sets and Logic
Potpourri
100
This problem-solving approach tackles things from the other way around.
What is working backward?
100
This method of data representation looks like a collection of dots.
What is a scatterplot?
100
This mnemonic device allows people to remember how to calculate a non-complicated type of payment for the use of their money.
What is "I am pretty."
100
This is a collection of distinct objects that are called elements.
What is a set?
100
This is Professor Belden's least favorite problem-solving method.
What is guess-and-check.
200
This problem-solving approach is perfect for people who take a hands-on approach to life.
What are manipulatives?
200
This graph uses a single shape to indicate 100%.
What is a circle graph or pie chart?
200
This type of payment for the use of someone's money is preferred because it pays more than the less complicated scheme.
What is compound interest?
200
This newly formed set contains only the elements that are in both sets.
What is the intersection of sets?
200
This set contains no elements.
What is the empty set of the null set?
300
Typically used along with another problem-solving strategy, this approach to solving problems has you disqualify possible answers by using the information presented to you.
What is eliminate possibilities?
300
These charts use icons to give a more engaging overall view of small sets of discrete data.
What is a pictogram chart?
300
This savings plan allows people to save for the future by depositing a smaller amount of money from each paycheck into the bank. Most retirement plans like 401k plans or IRA plans are examples of these.
What is a savings annuity?
300
What is the cardinality of set A?
Set A = { 1, 5, 7}
Set B = {12, 15, 22, 76}
What is three?
300
These are the names of Professor Belden's kittens.
What are Maxima and Minima?
400
This problem-solving approach has you using a series of rectangles to accept or disqualify possible answers.
What is matrix logic?
400
This is a diagram that visually displays all the possible logical relationships between a collection of sets. Each set is typically represented with a circle.
Overlapping circles indicate shared characteristics.
What is a Venn Diagram?
400
With this financial plan, you start with money in the account and pull money out of the account on a regular basis. Any remaining money in the account earns interest. After a fixed amount of time, the account will end up empty.
What is a payout annuity?
400
Write in words:
p = logic is fun
q = Math is amazing
~(p^q)
Logic and math aren't fun.
400
Fifty people are asked whether they have been to France or Spain.
Eighteen people have been to France. Twenty-three people have been to Spain. Six people have been to both.
By representing this information on a Venn diagram, find the probability that a person chosen at random has not been to Spain or France.
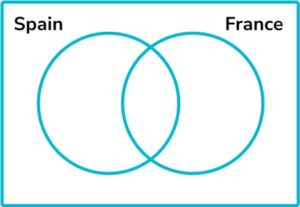
What is 15/50 or 3/10?
500
Some people were asked whether they liked strawberry ice cream or chocolate ice cream. 82% said they like strawberry ice cream and 70% said they like chocolate ice cream. 4% said they like neither.
By putting this information onto a Venn diagram, find the percentage of people who like both strawberry and chocolate ice cream.
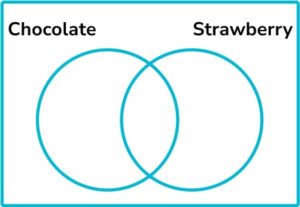
What is 56%?
500
This map provides a way to visualise values over a geographical area, which can show variation or patterns across the displayed location.
What is a choropleth map?
500
These are the four things you need to know to calculate compound interest.
What are the principal, the interest rate, the number of compounding periods, and the time?
500
The Venn diagram here shows the cardinality of each set.
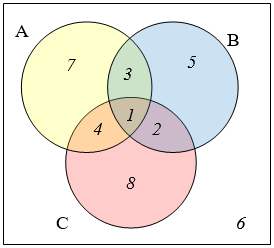
Find the cardinality of the set n(A ∩ C).
What is five?
500
These are the rules that determine how mathematical expressions are evaluated.
What is the order of operations?