Data
Box and Whisker
Dot plots
Frequency
Histograms
100
The Median of the Data Set is 3.5
15, 16, 7, 8, 5, 5, 3, 4, 8, 12, 10, 9, 6, 13
The Median of the Data Set is 8
100
What is the Median of the Data Set?
58, 71, 51, 67, 58, 55, 53, 57, 58, 62, 65
The Median of the Data Set is 58.
100
Dot plots have bars that represent frequency and are counted by 1's.
FALSE!
Dotplots do not have bars.
100
True or False?
Frequency is the measure of how often something occurs.
True!
100
What are the essentials for histograms?
X and Y Axis
Score Bins
Bin Width
Frequencies
Neat Work!
200
What are the 3 key parts to represent data?
What are their definitions?
Mean: Adding up all the numbers in the data set divided by how many numbers are in the data set.
Median: the middle number after writing the data from least to greatest. Middle 50% of the data.
Mode: Most occurring number
200
Find Q3, and what is the percentage of the data set?
{5, 5, 5, 7, 10, 10, 12, 15, 15, 17, 18, 25, 25, 28, 28, 30, 34, 40, 43}
75% of the Data is Q3 and below.
200
Create a dot plot and show Mr. Zunkel
5, 5, 5, 5, 3, 2, 1, -1, -3, 10, 11, 15, 4
Needs to be neat and organized.
200

What is the Median of the Histogram?
The median is in the 50-60 score bin.
200
True or False?
Is the frequency the highest at the 20-25 interval?
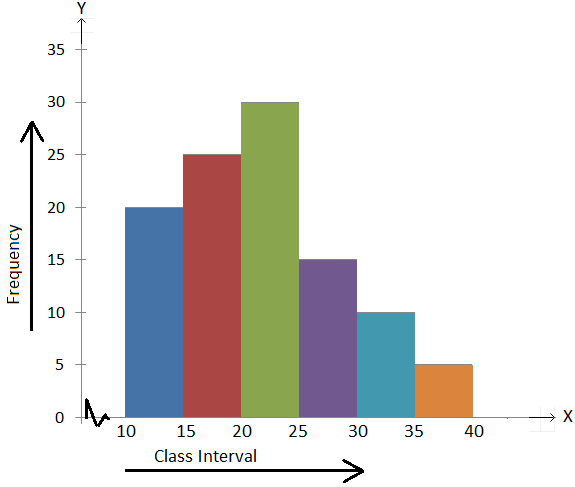
True!
300
True or False?
Q1 and Q3 represent 25% of the total data set.
False!
Q1: Represents 25% of the data set.
Q3: Represents 75% of the data set.
300
What are the Quartiles (Q1, Q2, Q3)
{5, 5, 5, 7, 10, 10, 12, 15, 15, 17, 18, 25, 25, 28, 28, 30, 34, 40, 43}
Q1: 10
Q2: 17
Q3: 28
300
What is the mode, range, and how many boys' heights were over 80.5 inches?
68, 70, 70, 71, 75, 80, 81, 82, 84, 75, 75, 80, 75, 77, 75, 80, 83, 80, 71, 70
Mode: 75
Range: 16
80.5 is Q3, so 25% is over 80.5 inches.
300
47, 52, 53, 55, 57, 60, 61, 62, 63, 65, 65, 65, 65, 68, 70, 72, 72, 75, 75, 75, 76, 77, 78, 80, 81, 82, 85, 88, 89, 90
Fill Out a Frequency Table:
40-50
50-60
60-70
70-80
80-90
90-100
40-50: 1
50-60: 4
60-70: 9
70-80: 9
80-90: 6
90-100: 1
300
Can we find the mean from a histogram?
No, we do not know the exact values from our data set.
400
Find the RANGE of these numbers:
18, 43, 11, 55, 16, 22, 25, 34, 87, 47, 62, 92, 43, 66, 20, 17, 42, 55, 52, 58, 86
The Range is the Max - Min
92-11 = 81
400
What fraction of the data is between 7.5 and 13.5?
16, 13, 7, 8, 10, 4, 14, 13, 11, 5, 16, 13
50%
Between Q1 and Q3
400
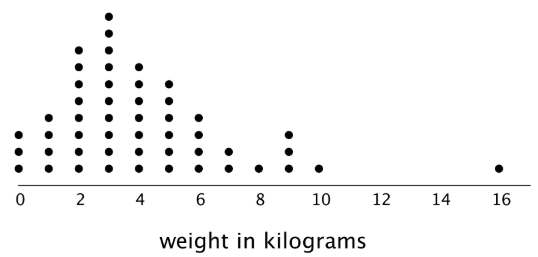
Find the Mean/Median/Mode of the Dotplot.
Mean: 4.14
Median: 3.5
Mode: 3
400
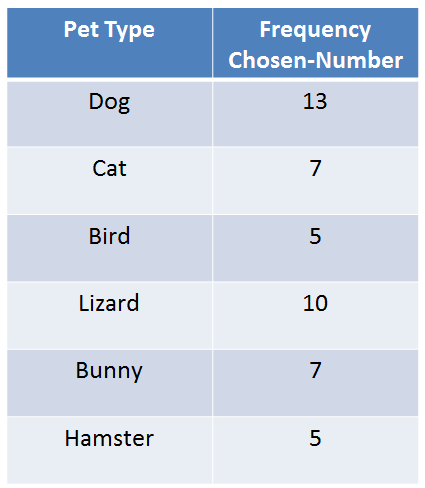
What animal is the median, and what percentage of people owned a dog?
Median: Bird Bin
Percentage: 27.66%
400
 How many frequencies do we have?
1 Total after we add them up.
500
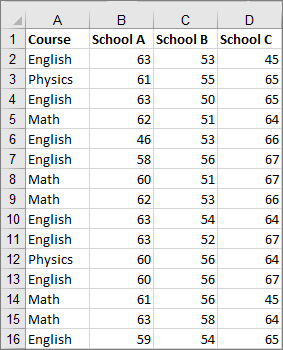
Which School Has the Greatest Mean Test Score?
School C has a mean of 62.733
School B has a mean of 53.333
School A has a mean of 60.267
500
74 76 80 86 69 69 74 94 100 70 72 76 89 94 96 83
Find the 5# Summary
Min: 69
Q1: 73
Med: 78
Q3: 91.5
Max: 100
500
Explain everything we can gather from a dot plot.
Mean, Median, Mode, Range, Max, Min, Q1, Q3, Frequency.
500
Create your own frequency table with intervals of 20. 50, 42, 119, 45, 68, 32, 67, 111, 61, 31, 75, 39, 62, 64, 49, 55, 51, 33, 117, 96, 64, 82
Intervals:
0-20: 0
20-40: 4
40-60: 6
60-80: 7
80-100: 2
100-120: 3
500
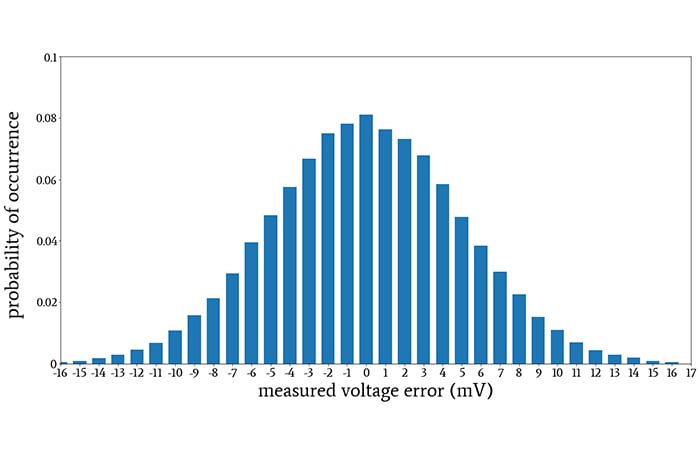
How would you describe the shape of the histogram?
Bell-Shaped.