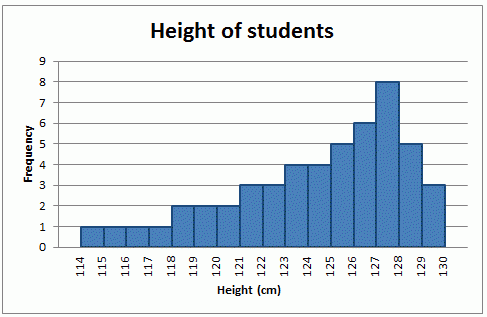
The shape of this Histogram.
Skewed left.
The symbol used to denote the sample mean.
x̄
All probabilities lie between these two values.
0 and 1.
In a standard normal distribution, find the P(z>1.5)
0.0668
Find the p-value if t = 1.27 , n = 24, and it's a two tailed test
0.2163
This type of data result when the data values are quantitative and the number of values is finite, or “countable.”
Discrete
The mean of this data:
0, 4, 2, 0, 1, 1, 2, 4, 3, 2
1.9
The value of C in the following probability distribution:
P(X=0)=0.4, P(X=1)=0.25, P(X=2)=C
0.35
The calculator function that would be used to find P(Z>1.35).
normalcdf
The calculator function used to create a confidence interval for a proportion.
1-PropZInt
A numerical measurement describing some characteristic of a population.
Parameter
The symbol for the standard deviation of a sample.
s
The probability you miss at most 1 day of classes in a week (PX≤ 1) where the number of missed classes has the following distribution:
P(X=0)=0.6, P(X=1)=0.1, P(X=2)= 0.25, P(X=3)=0.05
0.7
The probability that a randomly selected student takes between 10 and 20 minutes on a quiz if the time is normally distributed with a mean of 12 minutes and a standard deviation of 1.2 minutes.
0.9522
The alnernative hypothesis if you want to see if you can support the claim that more than 50% of cell phone users have an iPhone.
Note: H0: p=0.5
p>0.5
In this sampling technique, you select some starting point and then select every kth element in the population.
Systematic sampling
This rule states that a data value is considered unusually high if it is above 2 standard deviations from the mean or below 2 standard deviations from the mean.
Range Rule of Thumb
40.4% of consumers believe that cash will be obsolete in the next 20 years. Assume that 6 consumers are randomly selected. Find the probability that fewer than 3 of the selected consumers believe that cash will be obsolete in the next 20 years
0.536
The calculator function that would be used to find the value of Z so that 0.95 is the area to the left of Z.
invNorm
The calculator function used to conduct a hypothesis test for the mean.
T-Test
This type of graph would be used to display the average (mean) global temperatures for each of the most recent 100 years.
Time Series
For datasets that have a distribution that is approximately bell-shaped (or normal), this percentage of data should lie within 1 standard deviation from the mean.
The probability at least 1 person is left-handed in a random sample of 4 people under the assumption that 10% of people are left-handed.
0.3439
Assume that the amounts of weight that male college students gain during their freshman year are normally distributed with a mean of μ=1.2 kg and a standard deviation of σ=4.5 kg. If 25 male college students are randomly selected, find the probability that their mean weight gain during freshman year is between 0 kg and 3 kg.
0.8860
The 99% confidence interval for the mean if x̄=5.2, s=0.57, n=35. (Round to two decimals).
(4.94, 5.46)