Vocab
Correlation + Probability
Significance Tests
Confidence Interval
Quick Math
100
What is the probability of obtaining test results assuming the null hypothesis is true?
The p-value
100
r should be between __ and __
-1 and 1
100
Suppose we know that a t-statistic of 1.56 with 23 degrees of freedom gives a one-sided P -value of .0662. Then a t-statistic of 1.23 with 23 degrees of freedom would give a (bigger/smaller/unknown) P-value which would be (more/less/unknown) significant
Bigger, less
100
A quality control engineer is testing the lifespan of a new type of lightbulb. They take a random sample of 15 lightbulbs and record their lifespans (in hours). The sample mean lifespan is found to be 2,250 hours, and the sample standard deviation is 120 hours.
Estimate the true mean with 99% confidence.
2250 ± 92.23
[2157.77, 2342.23]
100
t* and z* can be found on ________
Table C
200
A professor wants to know the number of students at UO who are Psychology majors. He asked his Math 243 class what everyone’s major is and discovered that 20 of the 500 students are PSY majors (4%). According to UO’s website, the percentage is closer to 7%. State the p(hat) H0 and n.
p(hat)=0.07, H0=0.04, n=500
200
If r=-0.22, you can conclude that there is a ________, _________ relationship between the two variables
weak, negative
200
A study is done that determines the length of geckos to be normally distributed with µ=7in Amanda believes the mean length of geckos is less than 7in and conducts her own study where she randomly measures 10 geckos and finds their mean length to be 6 inches and sample standard deviation to be s=1in. She conducts her study using a significance level of 95% What is the null hypothesis, alternative hypothesis, and statistical significance at a level α=.05?
Ho: µ=7in, Ha: µ<7in, statistically significant so reject null hypothesis
200
A political pollster wants to estimate the proportion of registered voters in a city who support a particular candidate. In a random sample of 500 registered voters, 280 indicated they support the candidate. Construct a 90% confidence interval for the true proportion of registered voters in the city who support the candidate.
0.56 ± 0.0365
[0.5235, 0.5965]
200
What is the critical value if you have a 30-person sample and a one-tailed alpha level of 0.01?
2.462
300
The claim tested by a statistical test is called the…
Null Hypothesis
300
One year, many college-bound high school seniors in the U.S. took the Scholastic Aptitude Test (SAT). For the verbal portion of this test, the mean was 425, and the standard deviation was 110. Based on this information, what is the probability that students this year will score more than 350?
75.17%
300
Which test would you use for the following problem?
A school administrator claims that more than 60% of students regularly eat breakfast before school. A random sample of 150 students is taken, and it is found that 102 students eat breakfast regularly.
At a significance level of α = 0.01, does this sample provide sufficient evidence to support the administrator's claim?
A one-sample proportion test
300
What would be the sample size if a 99% z-confidence interval was [10.23, 16.49] and the standard deviation was 2.20?
sample size= 4
300
A researcher believes that a certain population of people favors "rock" in rock-paper-scissors more often than chance would predict. In a random sample of 200 games played by this population, "rock" was chosen 88 times. At a significance level of α = 0.05, does this data provide sufficient evidence to support the researcher's claim that "rock" is favored?
z = 3.31 so p=0.0007, so yes there is evidence to support the researcher's claim
400
You want to know how students at the University of Oregon feel about campus dining so you send out 1000 surveys to random uo emails and receive 45 surveys back. What would the population and sample be?
Population: all University of Oregon students
Sample: the 45 responses
400
A report by the NOAA Fisheries Service on yearling Chinook salmon at Lower Monumental Dam on the Snake River near Walla Walla, Washington, found a mean length of 149.8 mm and a standard deviation of 11.7 mm. What percent of the fish were less than 155 mm long?
67%
0.6700
(search for 0.44 in Table A)
400
A researcher wants to investigate whether there is a difference in the average test scores between two different teaching methods. Group A was taught using method 1, and Group B was taught using method 2. The following test scores were recorded:
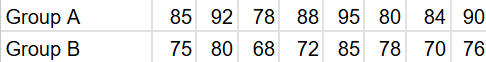
What kind of test would you use?
2-sample t-test
400
A researcher is interested in comparing the average heights of men and women in a particular city. They collect two independent random samples:
- Sample of men: n1 = 50, xˉ1 = 178 cm, s1 = 7 cm
- Sample of women: n2 = 60, xˉ2 = 165 cm, s2 = 6 cm
Construct a 95% confidence interval for the difference in average heights between men and women in this city.
13 ± 2.464
[10.536, 15.464]
400
Write the null and alternative hypothesis for this test:
A study of the effects of sleep on college student test scores if scientists believe that having a good night's sleep causes students to score higher. The scientists took a sample of 10 college students who did not get a lot of sleep before an exam and found their test scores had an average of 76 with a standard deviation of 1.3 and a sample of 10 college students who did get a lot of sleep before an exam and found their test scores had an average of 84 with a standard deviation of 2.1. Is their claim accurate at the α= 0.1 level?
Ho: μ1=μ2
Ha: μ1>μ2
500
SUPRISE MATH QUESTION:
Identify any outliers in the following set of data
6, 8, 19, 10, 31, 16, 13, 12, 9, 14
31 is an outlier
500
The weights of newborn babies in the US follow a Normal distribution with a mean of 7.5 lbs. and a standard deviation of 1.2 lbs. What percent of babies weigh between 7 lbs. and 8lbs.?
32.56%
0.3256
.6628-.3372
500
A researcher wants to investigate if there is a difference in the perceived comfort level of two brands of running shoes (Brand A and Brand B). They recruited 8 pairs of identical twins, where one twin from each pair wore Brand A and the other wore Brand B during a standardized run. After the run, each twin rated the comfort of their shoes on a scale of 1 to 10 (10 being the most comfortable). The following data was collected:
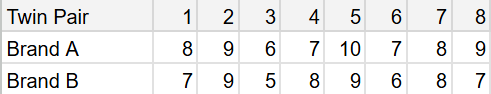
What kind of test would you use?
Matched pairs t-test
500
The student newspaper wants to poll student workers to determine what percentage supports going on strike. If they have no information to let them estimate the expected proportion, what is the smallest sample they can take to ensure that the margin of error in an 80% confidence interval will be less than 15%?
19 students
500
You run a two-tailed z-test and come up with a z-statistic of -1.94. Is this significant at the 5% level?
No, fail to reject the null hypothesis