Ordered Pairs
Slopes
Graphs
Probability
100
What are the coordinates for point A?

a) (2, -4)
b) (-2, 4)
c) (-4, 2)
d) (4, -2)
d) The coordinates for point A are (4,-2).
100
What is the slope of the graph of y = x?
The slope of the graph of y = x is 1.
100
Which ordered pair is on the graph of the function?

a) (-1, 2)
b) (6, -3)
c) (-2, -4)
d) (-6, 4)
b) The ordered pair, (6,-3) is on the graph of the function.
100
A regular number cube is rolled. What is the probability that a 3 will not be rolled?


A regular number cube is rolled. The probability that a 3 will not be rolled is .
200
What point is located at (-3, 3)?

point A
point B
point C
point D
Point A is located at (-3, 3).
200
There are 5 red marbles, 8 blue marbles, and 12 green marbles in a bag.
What is the theoretical probability of randomly drawing a red marble?
25%
20%
62.5%
41.7%
There are 5 red marbles, 8 blue marbles, and 12 green marbles in a bag.
The theoretical probability of randomly drawing a red marble is 20%.
200
Which line has a slope of -?

line a
line b
line c
line d
Line d has a slope of -.
200
A coin (H: heads; T: tails) is flipped and a number cube (1, 2, 3, 4, 5, 6) is rolled.
What is the sample space for this experiment?
a) H1, H2, H3, H4, H5, H6
b) H, T, 1, 2, 3, 4, 5, 6
c) H1, H2, H3, H4, H5, H6, T1, T2, T3, T4, T5, T6
d) T1, T2, T3, T4, T5, T6
c) A coin (H: heads; T: tails) is flipped and a number cube (1, 2, 3, 4, 5, 6) is rolled.
The sample space for this experiment is
H1, H2, H3, H4, H5, H6, T1, T2, T3, T4, T5, T6.
300
One spinner is divided into five equal sections numbered 1 to 5. A second spinner is divided into seven equal sections numbered 6 to 12.
How many total outcomes are there if both spinners are spun?
12
17
35
60
One spinner is divided into five equal sections numbered 1 to 5. A second spinner is divided into seven equal sections numbered 6 to 12.
There are 35 total outcomes if both spinners are spun.
300
What is the slope of the line that passes through the points (-2, 2), and (-4, -2)?
-
2
-2
The slope of the line that passes through the points (-2, 2), and (-4, -2) is 2.
300
Which table represents the function y = 3x – 1?
a) 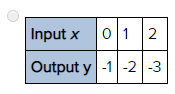
b) 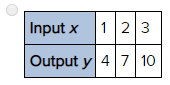
c) 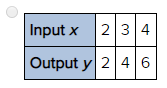
d) 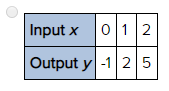
d) The following table represents the function
y = 3x – 1
300
There are five different colored cards in a hat (red, blue, green, yellow, and black). A card is randomly drawn and not replaced. Then a second card is drawn.
What is the probability that the first card will be red and the second card will be blue?
4%
5%
20%
25%
There are five different colored cards in a hat (red, blue, green, yellow, and black). A card is randomly drawn and not replaced. Then a second card is drawn.
The probability that the first card will be red and the second card will be blue is 5%.
400
There are 5 red marbles, 8 blue marbles, and 12 green marbles in a bag.
Several trials are performed with the following results: Red - 10, Blue - 12, Green - 28
What is the experimental probability of randomly drawing a green marble?
28%
24%
48%
56%
There are 5 red marbles, 8 blue marbles, and 12 green marbles in a bag.
Several trials are performed with the following results: Red - 10, Blue - 12, Green - 28
The experimental probability of randomly drawing a green marble is 56%.
400
What is the slope of line a?


3
-
-3
The slope of line a is
400
What is the equation of the function that is graphed as line a?
y = -x + 1
y = 3x - 1
y = 3x + 1
y = x - 1
The equation of the function that is graphed as line a is y = x - 1
400
A spinner with five equal-sized colored sections is spun with the following results:
Red - 16, Orange - 15, Yellow - 20, Green - 14
Blue - 15
Based on the experimental probability, predict the number of yellow results for 300 trials.
20
40
60
75
A spinner with five equal-sized colored sections is spun with the following results:
Red - 16, Orange - 15, Yellow - 20, Green - 14
Blue - 15
Based on the experimental probability, the number of yellow results for 300 trials is 75.
500
There are 5 red marbles, 8 blue marbles, and 12 green marbles in a bag.
What is the theoretical probability of randomly drawing either a red marble or a blue marble?
20%
32%
52%
13%
There are 5 red marbles, 8 blue marbles, and 12 green marbles in a bag.
The theoretical probability of randomly drawing either a red marble or a blue marble is 52%.
500
Select all that apply.
Given the points (3, 2) and (6, 4), which of the following are true about the line passing through these points?
a) The line has a slope of  .
.
b) The line represents a direct variation function.
c) The line has a slope of  .
.
d) The point (-6, 9) is also on the line.
b) and c):
Given the points (3, 2) and (6, 4), the following are true about the line passing through these points:
The line represents a direct variation function.
The line has a slope of .
500
Select all that apply.
Which graphed lines represent direct variation functions?

line a
line b
line c
line d
Lines a and b represent direct variation functions.
500
There are 5 red marbles, 8 blue marbles, and 12 green marbles in a bag.
What is the theoretical probability of randomly drawing a red marble and then a green marble?
10%
17%
9.6%
68%
There are 5 red marbles, 8 blue marbles, and 12 green marbles in a bag.
The theoretical probability of randomly drawing a red marble and then a green marble is 10%.